A candlestick tells you how price moved through time. A volume profile tells you how much traded at each price — turned sideways and stacked up the margin of your chart. The thick part is where institutions accepted value, and the Point of Control is where they accepted it most. This free tool draws it for every session, every instrument.
!Requires the NinjaTrader OrderFlow+ add-on for volumetric (bid/ask) bar data. Free to download, but it can't draw without it. Details below →
Every tick has a price and a size. Over a session, the indicator accumulates the contracts traded at each price level, then turns that distribution ninety degrees and draws it as a horizontal histogram. The fattest row is the Point of Control — the single price where the most contracts changed hands. Sort the rows by volume and take the top seventy percent: that's the Value Area, bounded by VAH and VAL. Classic Market Profile math, volume-based.
§ 02 · On Real ChartsEvidence, not marketing
The profile,
in practice.
Three ES sessions — inside value, edge of value, and the move that left value behind.
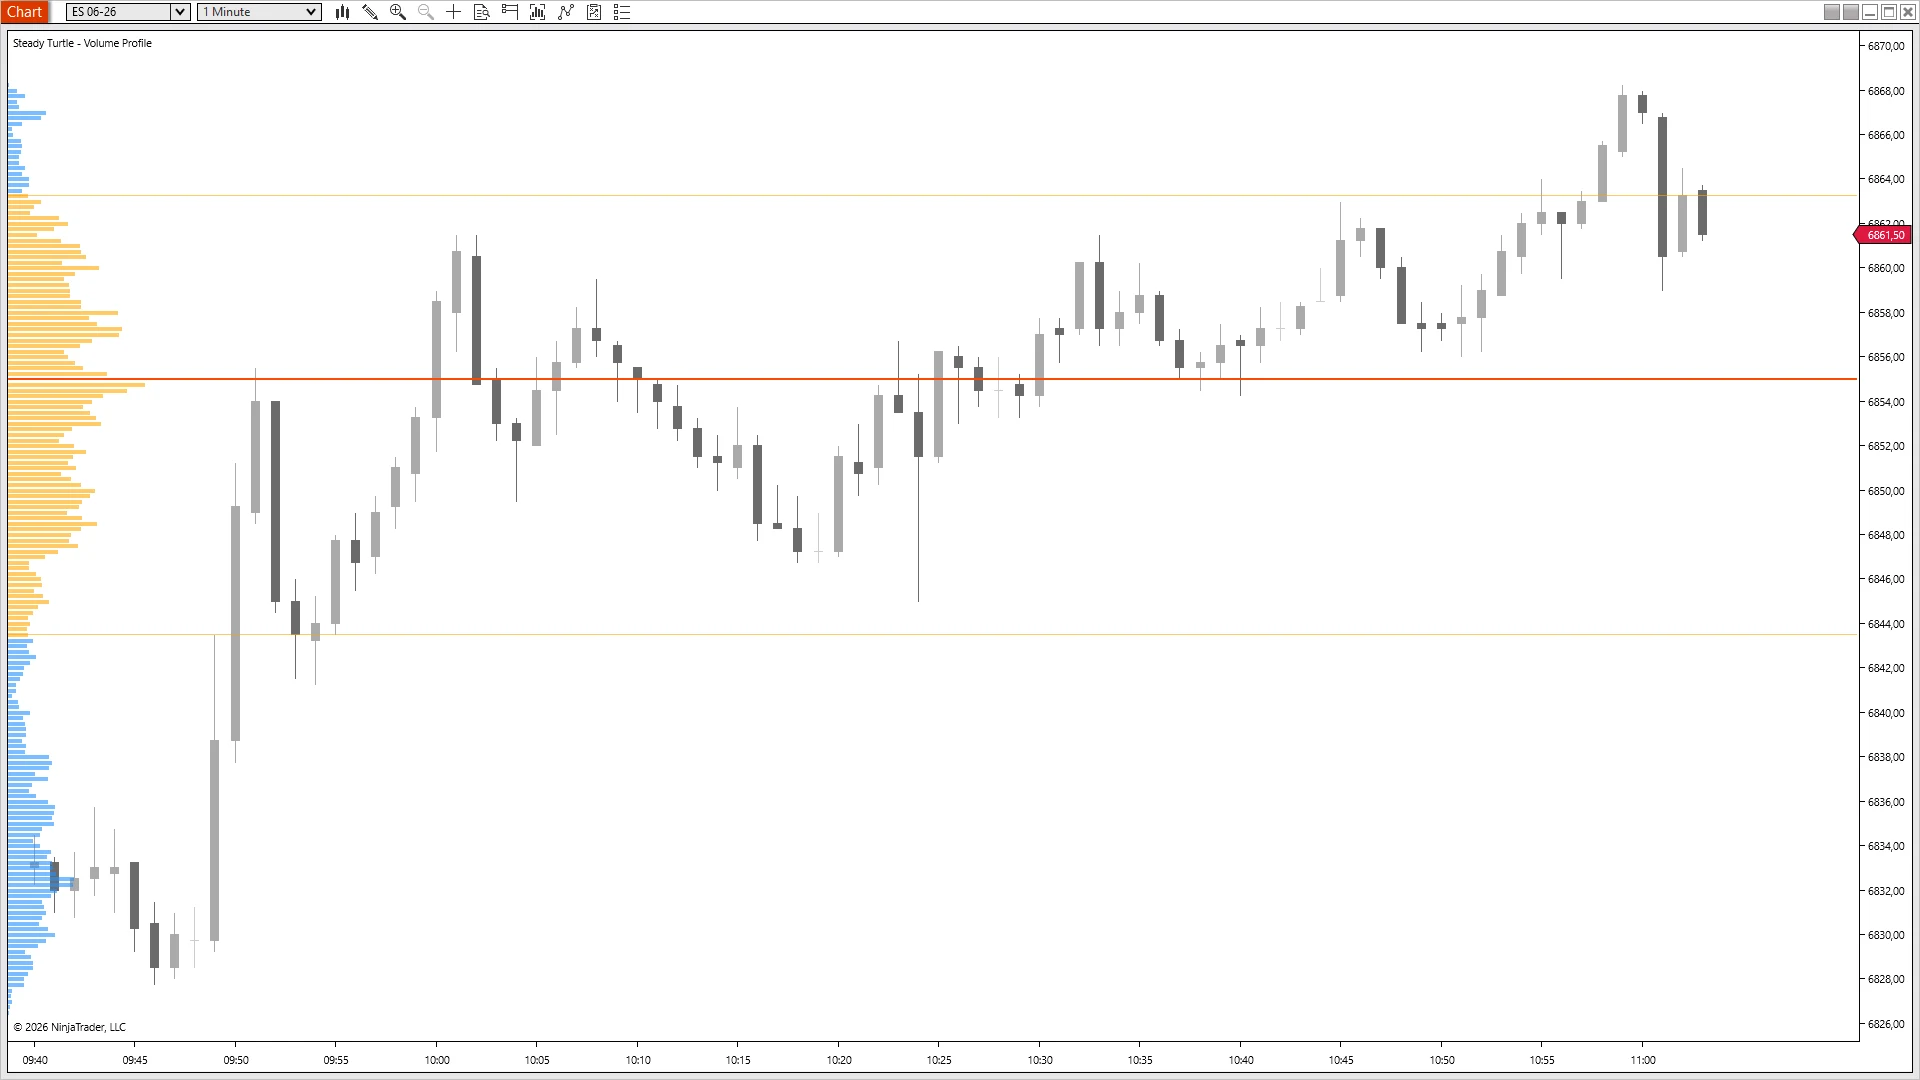
ES 06-26 · RTH · 1m
POC,
the magnet.
Where the most contracts trade, price comes back.
A hard rally from the 6832 low pushes through VAL, through POC at 6854, and into VAH at 6864 by 10:00. Then the structure shows up. Forty minutes of pullback action — 10:05, 10:15, 10:25, 10:30, 10:40 — every dip stops within a tick of POC 6854 and rallies. Six clean tests, no break. That's the magnet read in its most literal form: the price the session traded the most volume at is the price it keeps coming back to until something forces it elsewhere.
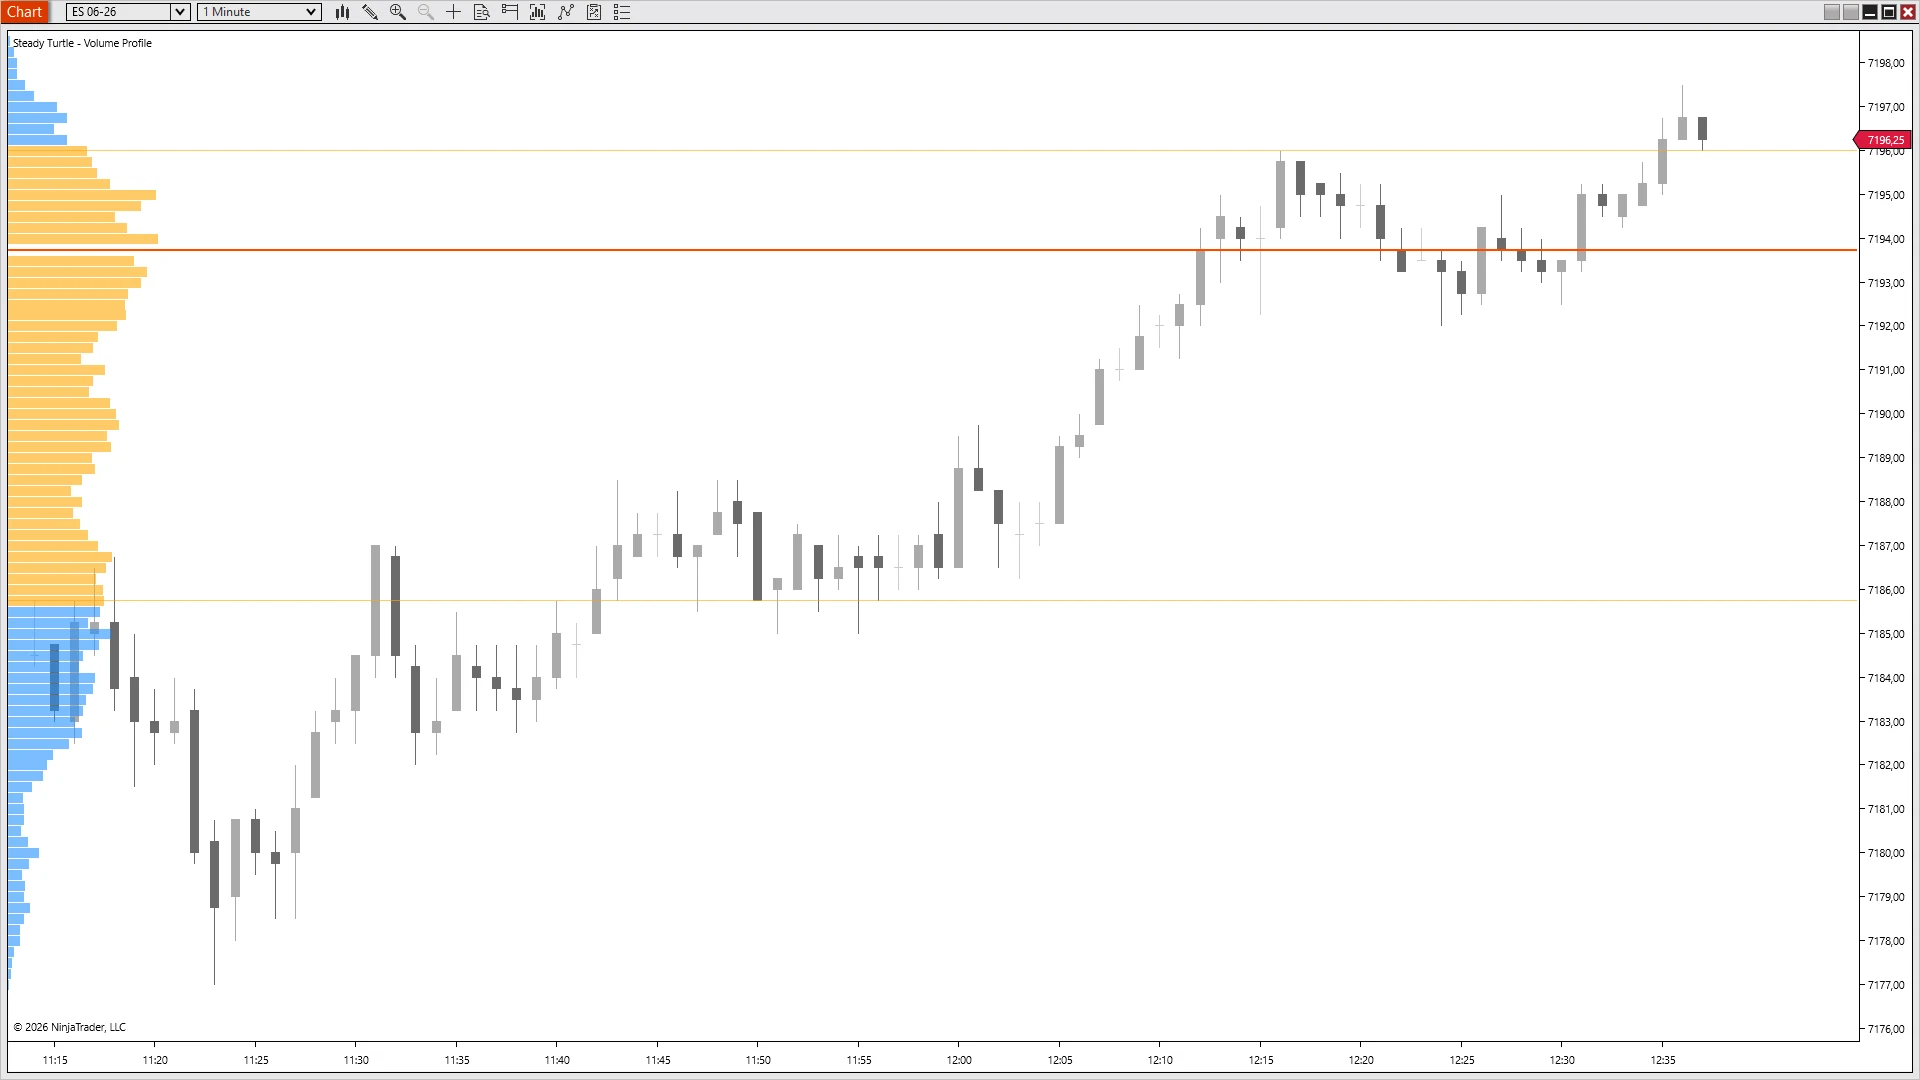
ES 06-26 · RTH · 1m
Through POC,
into VAH.
Top of value is where the rally exhausts.
Session prints the low at 7178 and rallies back into the profile from below. Through VAL (7185.50). Through POC (7194), with a brief rejection on the way up that holds. Into VAH at 7196 — and stops. Three more pushes try to clear it; each fails by a tick. The value-area high isn't a magic line, but it's the price above which the session's volume thins out hard, and rallies that haven't built energy don't punch through. Read the profile top-down before guessing where the move ends.
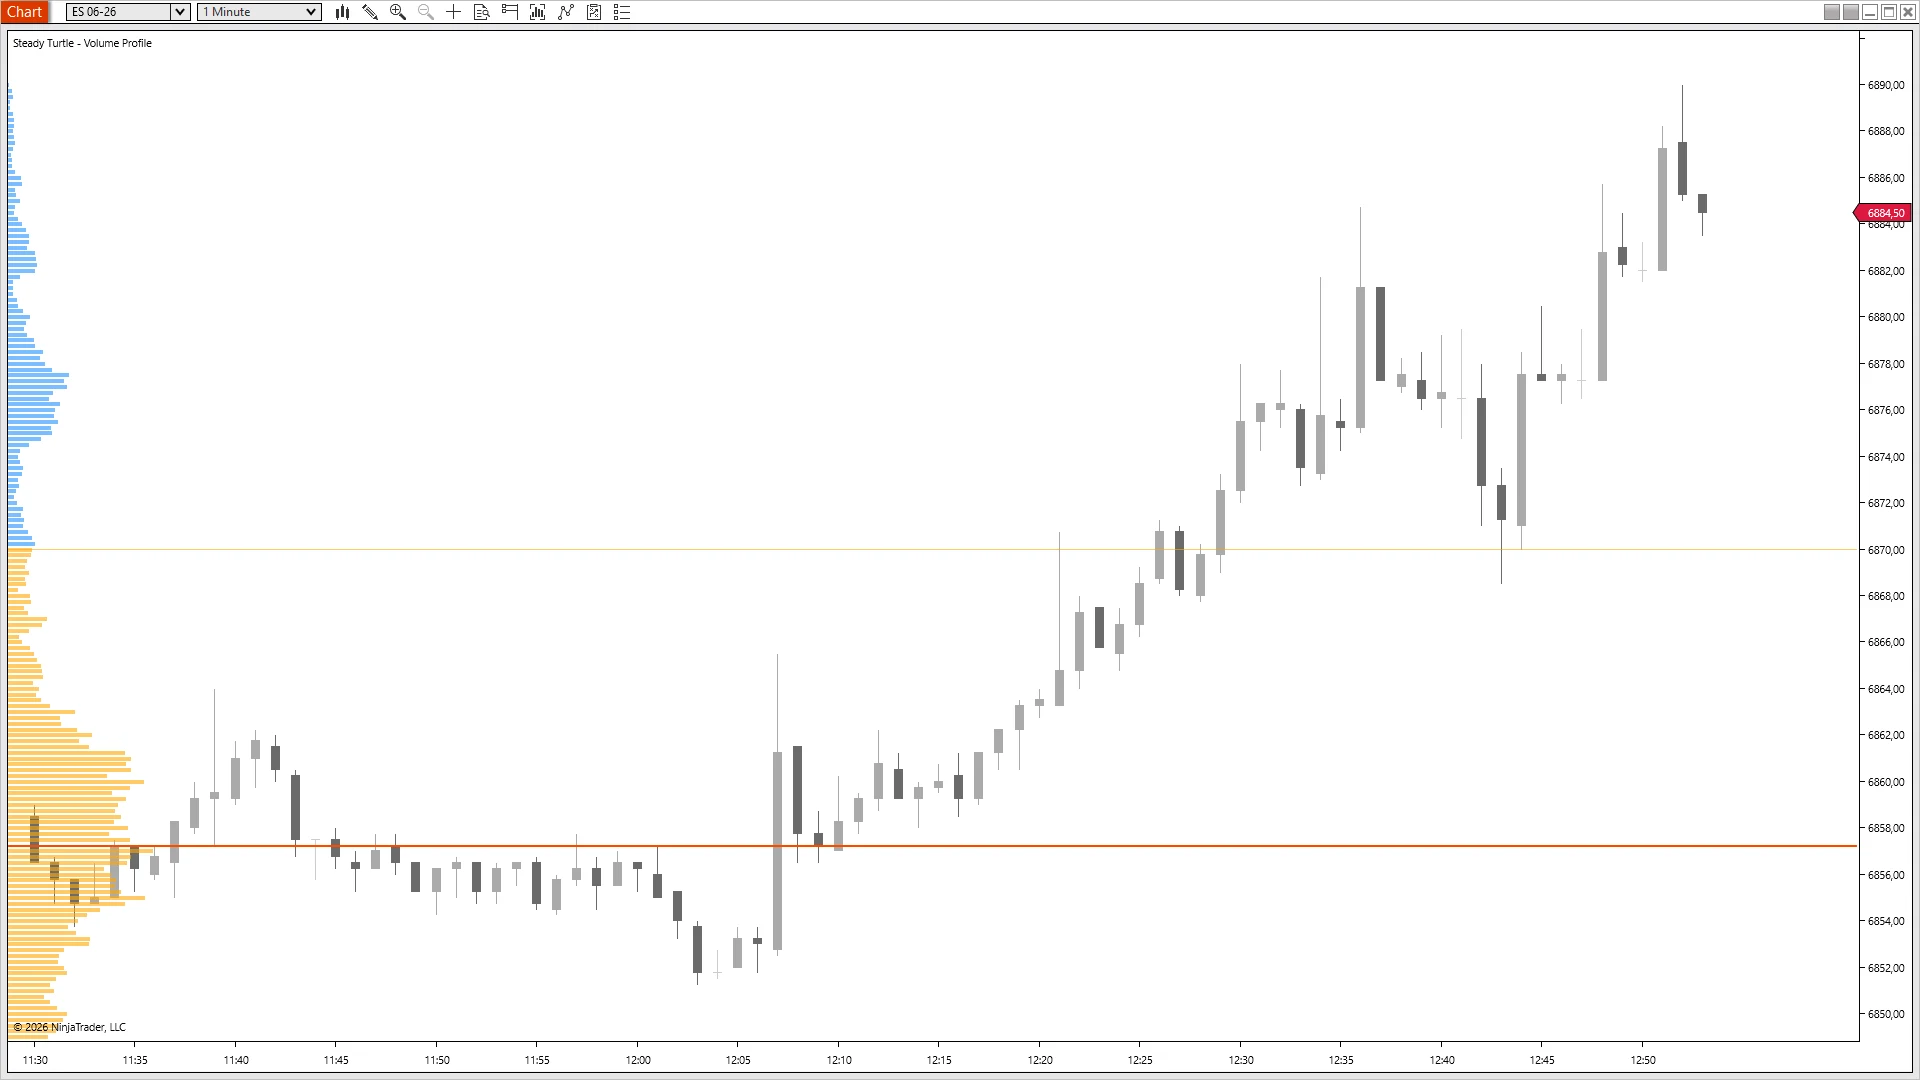
ES 06-26 · RTH · 1m
Out of the node,
no looking back.
When value gives way, the magnet flips to a launch pad.
Forty minutes of chop between 6852 and 6860 builds a thick orange cluster on the profile — the high-volume node that becomes POC at 6857. The session prints its low at 6852 at 12:05, reverses on a strong reclaim candle, and clears POC at 12:08. From there: no retest, no pullback to the node, no second chance to enter on the line. Straight trend up to 6890 by 12:50. Same level as the magnet trade, opposite outcome — once acceptance flips and price holds above the HVN, the cluster becomes the floor, not the destination.
§ 03 · The ReceiptsWhat traders say
What traders
actually
say.
No curated five-star walls. Three quotes from people running the free tool.
“
Can't believe this is free. I was paying for Volume Profile on another platform and this one's cleaner. The POC highlight is exactly what I wanted, nothing I didn't.
— Happy customer
“
Finally understand why price bounces where it does. Seeing the distribution makes support and resistance way more real than just drawing horizontal lines on yesterday's high. The value area rotation trade has been my best setup for months.
— Happy customer
“
Ran this free one for a year before buying Delta Profile. Volume told me where they traded; delta told me who won at each level. Using both is a completely different game — but starting with just volume was plenty to prove the concept.
— Happy customer
§ 04 · DownloadFree · No credit card · No expiry
Free, for as long as you want it.
Drop in an email, I'll send the download link. You're on my newsletter afterwards — one email most months, unsubscribe whenever. No payment, ever.
Volume Profile
Volume distribution, POC, Value Area. Everything the staple needs to be.
Free
Forever
Session volume distribution
Point of Control, auto-highlighted
Value Area with configurable percent
VAH / VAL lines, extended across the chart
Delta per price level (buyers vs sellers)
Aggressive-flow shading
Editor's Pick
Complete Bundle
The complete suite. Delta Profile included — the tool the free volume profile upgrades into.
✓ 100% Free✓ Lifetime Updates✓ NT8 8.1.6+✓ Any instrument
§ 05 · QuestionsObjection handler
A
few things
first.
Everything traders ask me before they download. If yours isn't here, email me →.
A histogram of how many contracts traded at each price during the session, laid out vertically on the left margin of the chart. A candlestick tells you where price went; the profile tells you how much size actually changed hands at each level. The fattest row is the Point of Control; the top seventy percent of rows by volume is the Value Area, with a VAH line at the top and a VAL line at the bottom.
Because the free tool is enough to prove whether profile-based trading fits your setup, and the upgrade — Delta Profile — is the tool that matters once you're convinced. Volume Profile shows you where trading occurred; Delta Profile adds the dimension of who was aggressing at each level. The free one is the foundation; the paid one is the insight on top. Pay nothing, see if it works, upgrade when it does.
This free tool is a classic Volume Profile: total volume per price, POC, Value Area, VAH/VAL. The paid Delta Profile ($49) replaces “total volume” with “net delta” at every price — buyers minus sellers, per level. Volume shows acceptance; delta shows control. If you trade reversals off the POC, the delta reading at that level tells you whether buyers or sellers defended it.
Closely related, not identical. Market Profile (TPO) counts how many fifteen-minute blocks traded at each price — the time dimension. Volume Profile counts actual contracts. On high-volume trends the two can look similar; on thin sessions they diverge, because time-based TPO over-weights prices that price sat at without much trading. Volume Profile is the more direct read.
Yes — OrderFlow+ is required. The indicator builds the profile from NinjaTrader's Volumetric bars, which are an OrderFlow+ feature. Without OrderFlow+ enabled on your NT8 license, the volumetric series the profile reads from doesn't populate, and the chart will be empty no matter which data feed you use. The indicator itself is free, but it has nothing to display without OrderFlow+. You can check whether you already have it under Help → About in NinjaTrader, or by trying to add a "Volumetric" bar type to a chart. On top of OrderFlow+, you also need a data feed that provides real per-trade volume — Kinetick, Rithmic, CQG, and most professional futures feeds qualify.
Any instrument with real volume data. It's designed for liquid futures — ES, NQ, MES, MNQ, CL, GC, 6E — where institutional volume is the primary signal. It also works on equities. FX and crypto can be run but the volume numbers there are less meaningful because different venues report different sub-sets of activity.
Yes, every edition — Free NT8, NT8 Lifetime License, and every tier in between. The only requirement is NinjaTrader 8 version 8.1.6 or newer — that's the build where NinjaTrader introduced email-based licensing, which the indicator uses to authenticate. Older builds can't authenticate; update via NT8's Control Center → Help → Check for Updates first if you're on an earlier version.
Yes — anywhere you sign in to NinjaTrader 8 with your user email. The license is tied to your NT8 user, not the machine, so desktop, laptop, and VPS all work the same. One user, unlimited machines.
Yes, lifetime updates. Every new version is free forever. If you buy the Complete Bundle, every future indicator I ship is also included at no extra cost.
Indicators are non-refundable — once you download, the software is yours to keep. Two ways to de-risk before buying: (a) try any of the free indicators first to confirm they load and run on your setup, and (b) email me with any pre-purchase questions at info@steady-turtle.com.
§ 06 · Settings ReferenceFor the record
Every knob,
exposed.
This is the full settings panel for the free version. Everything you need to style the profile and calibrate the Value Area — nothing you don’t.
Name
Default
What it does
Session Start Time (ET)
09:30
Clock time the profile starts accumulating each day. 09:30 for RTH; set to 18:00 for the full overnight futures session.
Session End Time (ET)
16:00
Clock time the profile stops updating. Default matches the RTH close. Supports overnight sessions — set Start later than End to span midnight.
Profile Width
150
Maximum width in pixels for the histogram on the chart margin (50 – 500).
Anchor
Left
Which chart edge the profile is anchored to — Left (default) or Right. Bars extend inward toward the price action.
Profile Color
DodgerBlue
Fill color for volume bars outside the Value Area.
Profile Opacity
60
Transparency of profile bars (10 – 100).
Show POC
True
Highlight the highest-volume price with a distinct color and optional extended line.
POC Color
Yellow
Stroke color for the Point of Control.
POC Opacity
100
Opacity of the POC line (10 – 100).
Extend POC
True
Draw the POC as a horizontal line extending to the current bar.
POC Line Width
2
Pixel width of the extended POC line (1 – 10).
Show Value Area
True
Highlight bars inside the Value Area with a distinct color.
Value Area Color
Orange
Fill color for volume bars inside the Value Area.
Value Area Opacity
60
Transparency of Value Area bars (10 – 100).
Value Area Percent
70
Percentage of total volume included in the Value Area (50 – 90). Classic Market Profile default is 70.
Show VA Lines
True
Draw the VAH and VAL as horizontal lines.
VAH Color
Orange
Stroke color for the Value Area High line.
VAL Color
Orange
Stroke color for the Value Area Low line.
VA Line Opacity
60
Opacity of the VAH / VAL lines (10 – 100).
VA Line Width
1
Pixel width of the VAH / VAL lines (1 – 10).
Extend VA Lines
True
Keep VAH / VAL extended across the chart, not just at the profile edge.
Debug Mode
False
Print diagnostic info to the NinjaScript output window. Off unless you are troubleshooting.
Run the free volume profile for a couple of weeks. When you start asking not just where price traded but who was aggressing at each level, Delta Profile is $49 and the Complete Bundle is $299 — and you'll know which makes sense by then.
Futures and forex trading contains substantial risk and is not for every investor. An investor could potentially lose all or more than the initial investment. Risk capital is money that can be lost without jeopardizing ones' financial security or life style. Only risk capital should be used for trading and only those with sufficient risk capital should consider trading. Past performance is not necessarily indicative of future results.
Testimonials appearing on this website may not be representative of other clients or customers and is not a guarantee of future performance or success.
Hypothetical Performance Disclosure
Hypothetical performance results have many inherent limitations, some of which are described below. No representation is being made that any account will or is likely to achieve profits or losses similar to those shown; in fact, there are frequently sharp differences between hypothetical performance results and the actual results subsequently achieved by any particular trading program. One of the limitations of hypothetical performance results is that they are generally prepared with the benefit of hindsight. In addition, hypothetical trading does not involve financial risk, and no hypothetical trading record can completely account for the impact of financial risk of actual trading. For example, the ability to withstand losses or to adhere to a particular trading program in spite of trading losses are material points which can also adversely affect actual trading results. There are numerous other factors related to the markets in general or to the implementation of any specific trading program which cannot be fully accounted for in the preparation of hypothetical performance results and all which can adversely affect trading results.