The first five minutes after the cash open print a range so tight you can count the candles. The indicator marks the high, low, and midpoint of that range — or the 15, 30, or any window you configure — and extends them through the RTH close. Break above the line and the session has a direction. Fail back inside and the setup flips.
Or get all 12 in the Complete Bundle · $299 · see pricing →
ES 03-26
1m5m15mRTH
O 5907 · H 5928 · L 5902 · C 5923
● NinjaTrader 8 Workspace · Opening Range LoadedCME Globex · Live
§ 01 · The MechanicThe idea, in one page
Five candles,
three numbers,
all day.
The opening range — the first few minutes after the cash open — is the session's earliest structural reference. Default window is 09:30 to 09:35 ET; the indicator locks the high, low, and midpoint at the end-time, extends the three lines through the RTH close, and keeps them live as every candle after trades against them. Prefer a 15-minute, 30-minute, or full-hour window? Change one setting; the math follows.
§ 02 · On Real ChartsEvidence, not marketing
The indicator, in the
wild.
Three MNQ mornings, three things the 5-minute opening range did — caught the unwind, capped the recovery, flipped support on the retry.
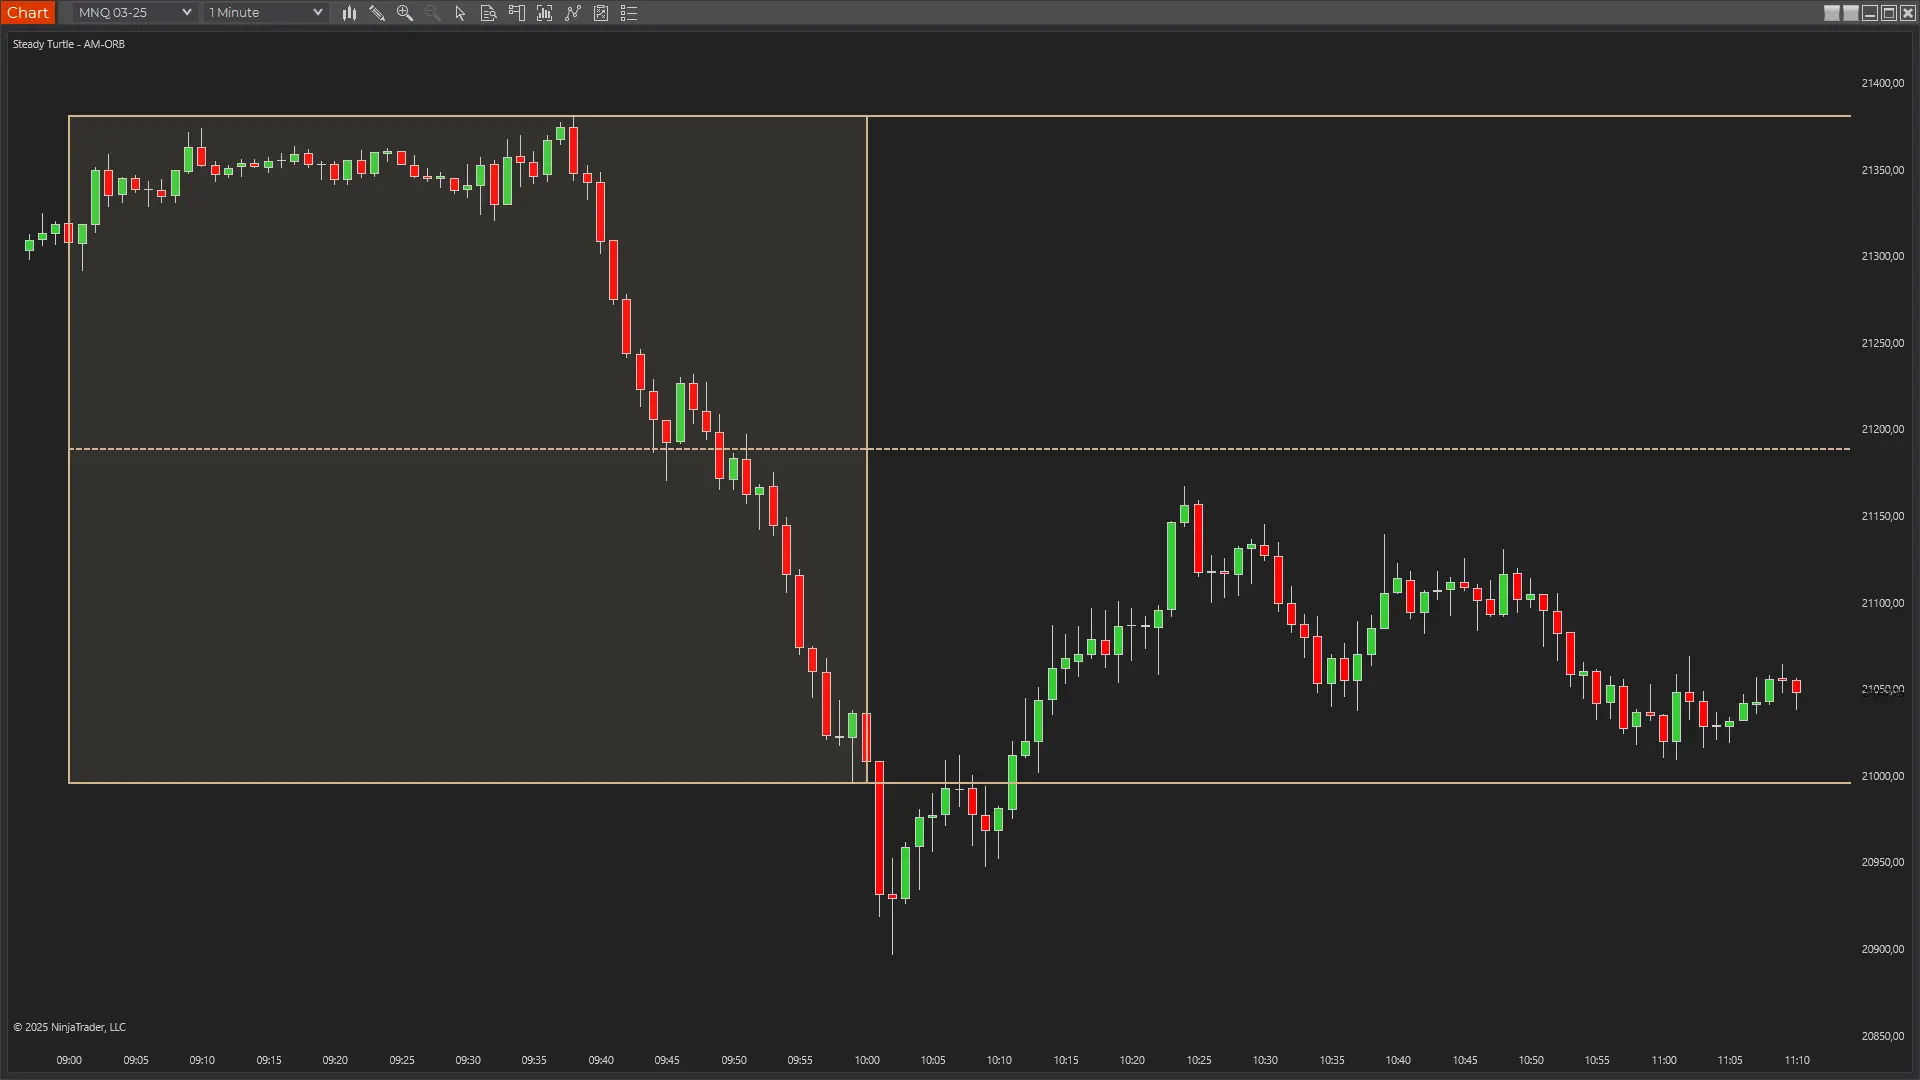
MNQ 06-26 · 5-MIN OR · 1m
Run above,
fall right through.
Both lines paid — once on the trend, once on the catch.
The 5-minute range locks at 09:35 with OR High at 27160 and OR Low at 27070 — a 90-point opening range from a single wide-spread bar. Price pops above the box on the next candle and runs into 27250 by 09:50, then holds above OR High for forty minutes. At 10:35 the line gives way; three candles slice through the midline at 27115 and into OR Low at 27070, where the wick prints 27040 and reverses on the same bar. Above-range trend for the morning, OR Low as the catch on the unwind.
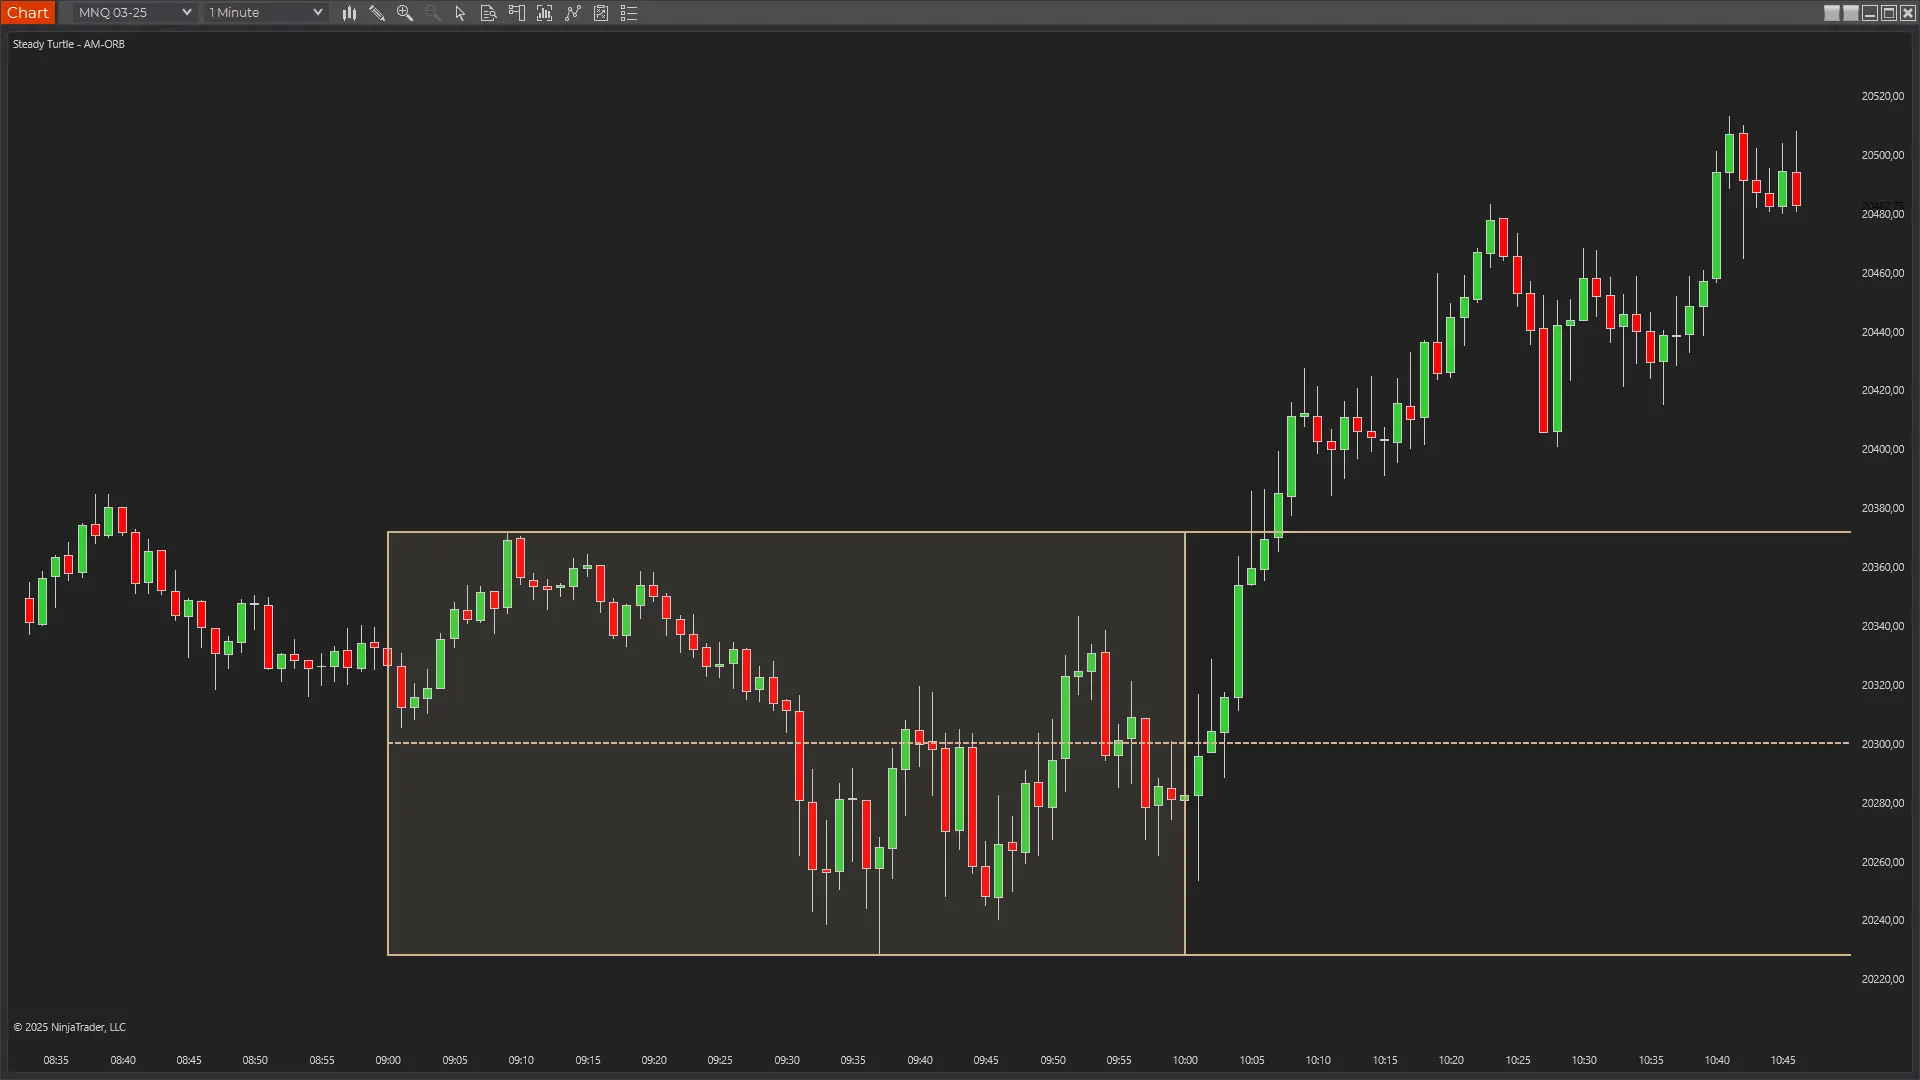
MNQ 06-26 · 5-MIN OR · 1m
Lose the line,
watch it cap you.
Once it's broken, the level works the other way.
The 5-minute range locks at 09:35 — OR High at 27430, OR Low at 27360, midline at 27395. Price holds inside the box for the next ten minutes, then breaks below OR Low at 09:45 and dumps 60 points into 27300 by 09:53. The reclaim attempt at 10:00 stalls at OR Low to the tick — and from there, the line caps everything. Six tests across the next forty-five minutes, every one rejecting back down. The single poke up to the midline at 10:35 fails inside two candles. The level that should have been support became the ceiling.
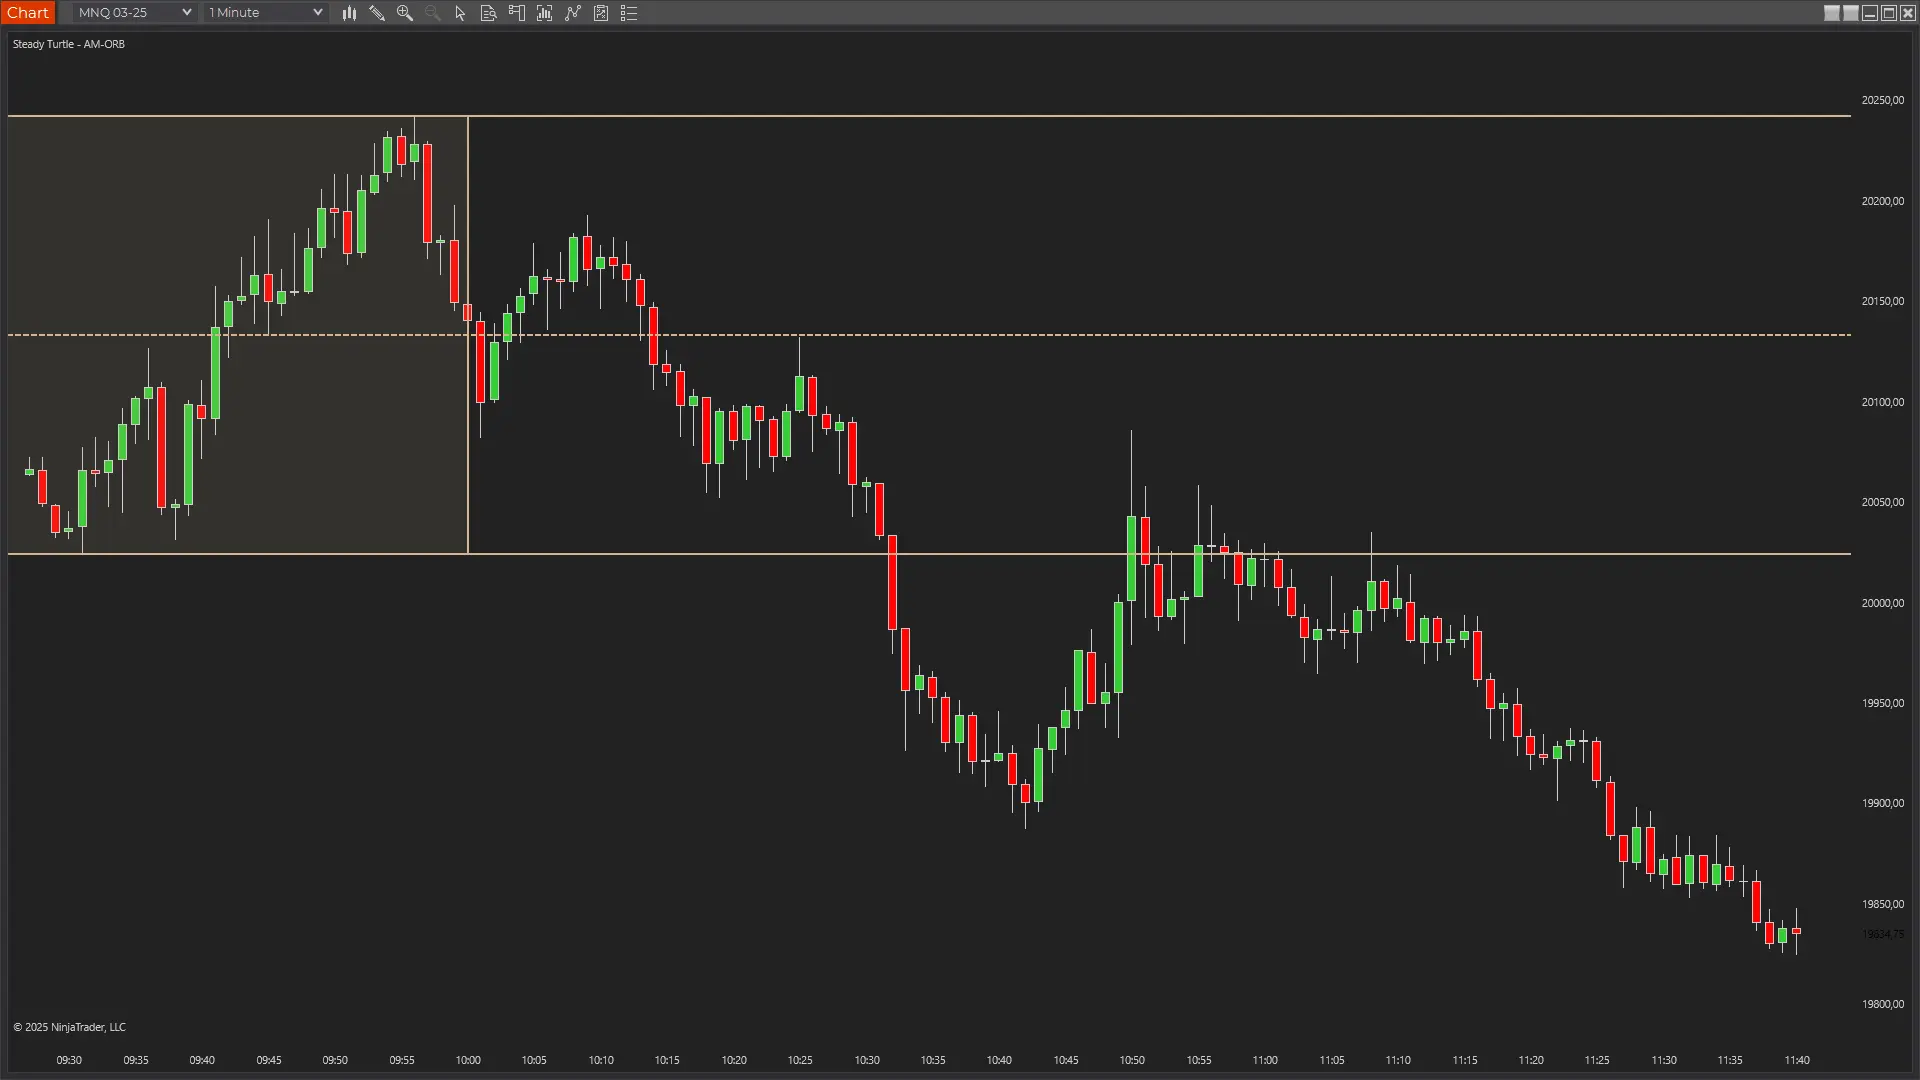
MNQ 06-26 · 5-MIN OR · 1m
First leg fades,
second leg runs.
OR Low catches the failed leg. OR High flips on the retry.
The 5-minute range locks at 09:35 — OR High at 27020, OR Low at 26965, midline at 26990. Price clears OR High on the next candle and runs 85 points into 27100 by 09:50. The pullback overshoots — straight back through OR High, through the midline, into OR Low at 26970, where the wick reverses. Thirty minutes of consolidation between OR Low and OR High, then a second break above the box at 10:35 that climbs to a fresh session high at 27090 by 10:55. OR Low caught the failed first leg; OR High flipped from resistance to support for the second.
§ 03 · The ReceiptsWhat traders say
What traders
actually
say.
Three quotes, three different reasons this one earned a slot in the workspace.
“
This is part of my morning routine now. Used to draw these levels by hand every single day — now they're already there when I open my chart.
— Verified buyer
“
Great for spotting failed breakouts. When price pokes out of the box and gets sucked back in, that's usually a solid fade setup — and the midpoint gives me a clean first target.
— Verified buyer
“
I run this with the Initial Balance indicator to get the full morning picture. OR shows the first five minutes, IB shows the first hour with extensions — together they frame the whole session.
— Verified buyer
§ 04 · PricingOne-time · No discounts · No expiry
One indicator. Or everything.
The math writes itself. À la carte is $49. The bundle is $299 for everything — including every indicator I ship next year.
Everything traders ask me before they buy. If yours isn't here, email me →.
The opening range is the price range established during a defined window around the cash open. This indicator's default window is 09:30 – 09:35 ET — the first five minutes of cash. The high, low, and midpoint of that window are the earliest structural references the session gives you. Prefer a longer window? Change End Time to 09:45 for 15 minutes, 10:00 for 30 minutes, or 10:30 for the full hour.
Yes — that's the point. Start, end, and extension times are all configurable. Common variants: 5 minutes (default), 15 minutes, 30 minutes, full hour, or any custom window you define. The indicator recalculates the high, low, and midpoint based on whatever window you set — run multiple instances at different windows if you want.
Both track a range after the cash open, at different durations. Opening Range is the short-window version — default 5 minutes — with a simple high/low/midpoint. Initial Balance is the longer, market-profile window — default 60 minutes (09:30 – 10:30) — and adds percentage-based extension targets (+100%, +200%, etc.) beyond the range. Running both is common: OR for the earliest directional tell, IB for the session's structural frame.
It's the midpoint between the opening range high and low. If OR High is 5912 and OR Low is 5902, the midline sits at 5907. The line extends past the box to your configured end time, so the level stays visible all session.
Any instrument NT8 can chart — ES, MES, NQ, MNQ, YM, RTY, CL, GC, equities, FX. The indicator uses wall-clock time, so it works on anything with a defined session open. Default configuration is tuned for US index futures and the 09:30 ET bell.
Times are specified in ET and the indicator respects your NinjaTrader timezone settings. Whether you're trading from Europe, Asia, or the US west coast, the window draws at the correct wall-clock time for the ET reference.
Yes, every edition — Free NT8, NT8 Lifetime License, and every tier in between. The only requirement is NinjaTrader 8 version 8.1.6 or newer — that's the build where NinjaTrader introduced email-based licensing, which the indicator uses to authenticate. Older builds can't authenticate; update via NT8's Control Center → Help → Check for Updates first if you're on an earlier version.
Yes — anywhere you sign in to NinjaTrader 8 with your user email. The license is tied to your NT8 user, not the machine, so desktop, laptop, and VPS all work the same. One user, unlimited machines.
Yes, lifetime updates. Every new version is free forever. If you buy the Complete Bundle, every future indicator I ship is also included at no extra cost.
Indicators are non-refundable — once you download, the software is yours to keep. Two ways to de-risk before buying: (a) try any of the free indicators first to confirm they load and run on your setup, and (b) email me with any pre-purchase questions at info@steady-turtle.com.
§ 06 · Settings ReferenceFor the record
Every knob,
exposed.
A fully configurable window — 5, 15, 30 minutes or whatever you trade. Box styling to match any workspace. Extension lines that persist exactly as long as you want them. Here's what ships in the settings panel.
Name
Default
What it does
Start Time (ET)
09:30
When the opening range calculation begins. Default is the cash open.
End Time (ET)
09:35
When the range is finalized. The high, low, and midpoint freeze at this time. Default is the 5-minute opening range — change to 09:45 for 15 minutes, 10:00 for 30 minutes, or any custom window.
Extend Lines Until (ET)
16:00
Extension lines (High, Mid, Low) stop drawing after this time. Default ends at the RTH close.
Max Sessions
5
Maximum number of past sessions the indicator keeps on the chart.
Session Name
OR
Prefix used in labels (OR H, OR M, OR L). Change to match a custom naming scheme.
Box Color
Tan
Fill and outline color for the range box and extension lines.
Box Opacity
10
Range box fill opacity (1 – 100). Lower values keep candles readable through the box.
$49 buys the indicator. $299 buys everything — plus every one I ship next year. Either way, one payment, no subscription, and it runs wherever you log into NinjaTrader.
Futures and forex trading contains substantial risk and is not for every investor. An investor could potentially lose all or more than the initial investment. Risk capital is money that can be lost without jeopardizing ones' financial security or life style. Only risk capital should be used for trading and only those with sufficient risk capital should consider trading. Past performance is not necessarily indicative of future results.
Testimonials appearing on this website may not be representative of other clients or customers and is not a guarantee of future performance or success.
Hypothetical Performance Disclosure
Hypothetical performance results have many inherent limitations, some of which are described below. No representation is being made that any account will or is likely to achieve profits or losses similar to those shown; in fact, there are frequently sharp differences between hypothetical performance results and the actual results subsequently achieved by any particular trading program. One of the limitations of hypothetical performance results is that they are generally prepared with the benefit of hindsight. In addition, hypothetical trading does not involve financial risk, and no hypothetical trading record can completely account for the impact of financial risk of actual trading. For example, the ability to withstand losses or to adhere to a particular trading program in spite of trading losses are material points which can also adversely affect actual trading results. There are numerous other factors related to the markets in general or to the implementation of any specific trading program which cannot be fully accounted for in the preparation of hypothetical performance results and all which can adversely affect trading results.