MNQ 06-26 · Globex · 5m
Both extremes rejected. VWAP, the magnet.
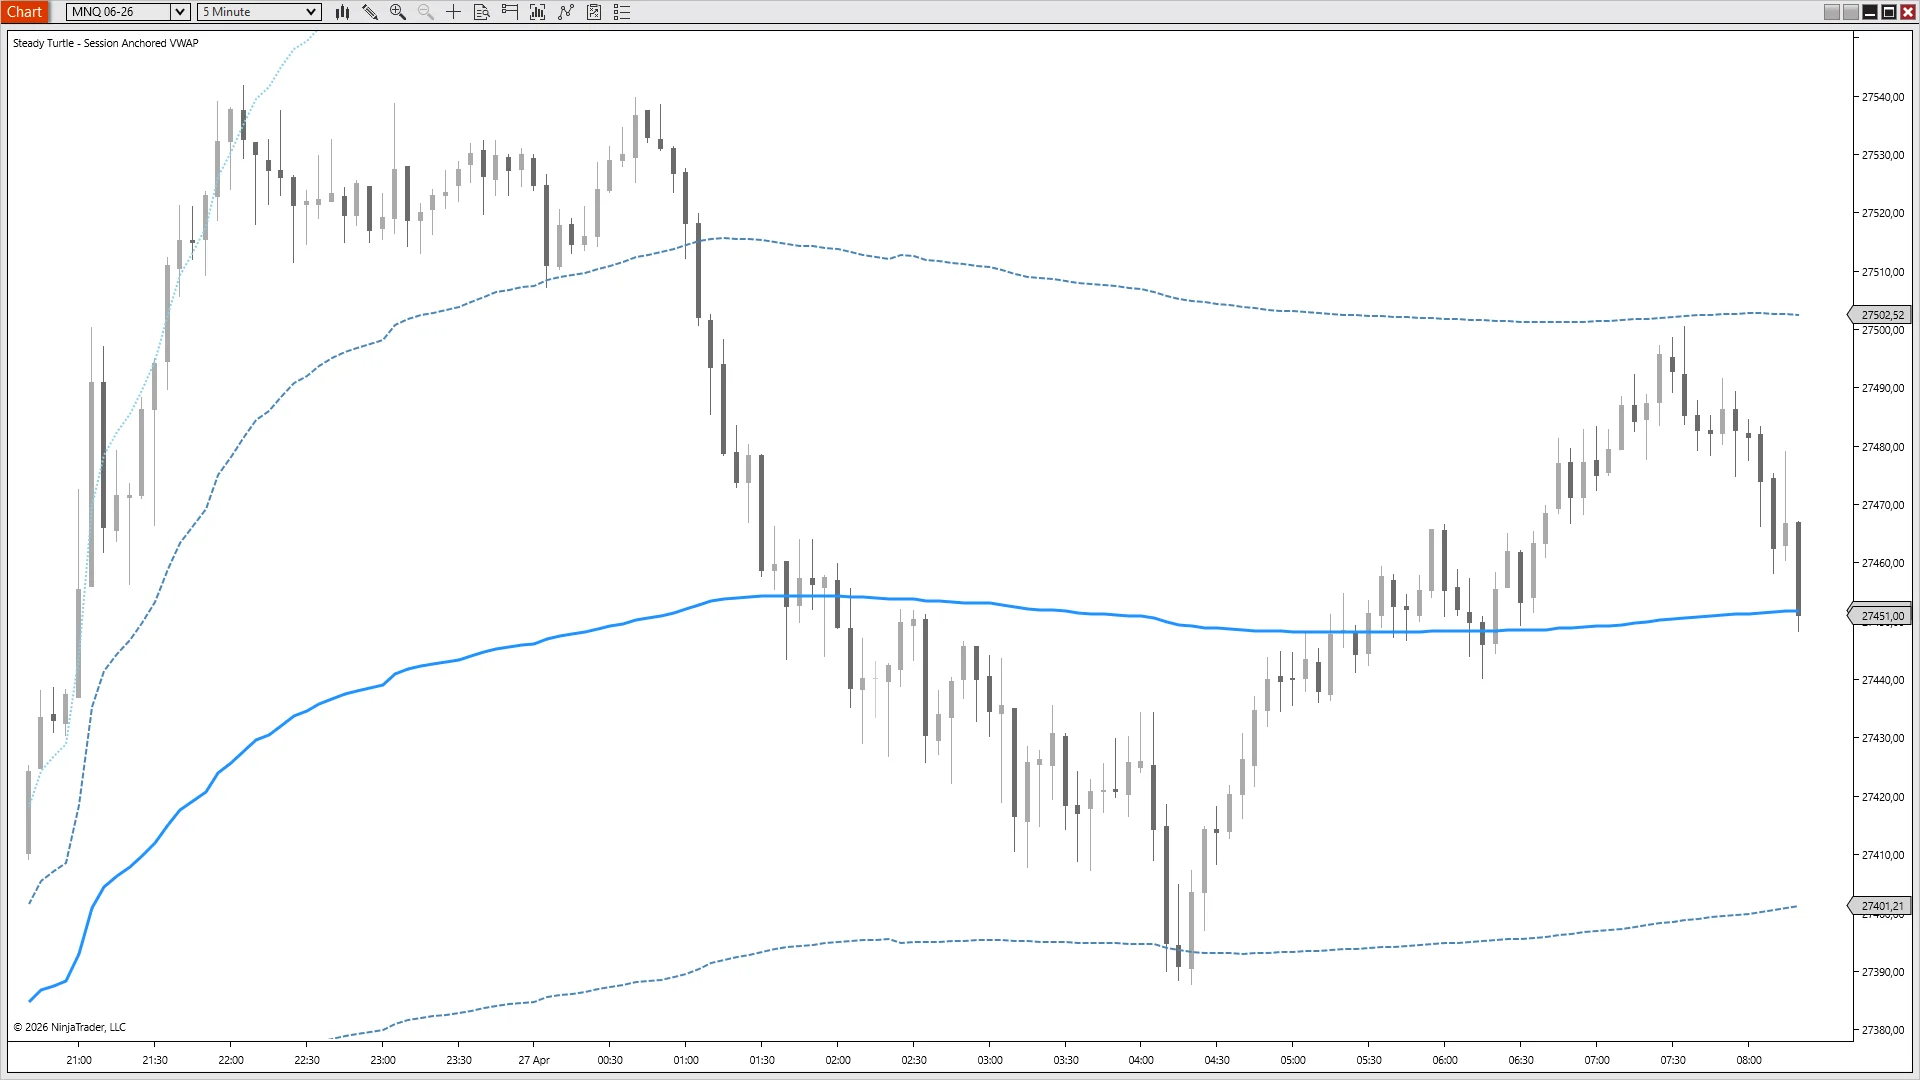
Two-sided session, Globex.
Asia rallies straight into the +2σ band at 27545, prints a wick, and rejects. The selloff carries through VWAP all the way down to -1σ at 27390 — where it stops cold and reverses. By the end of the session price is back at VWAP at 27451, almost exactly where it started. Two extremes touched, both rejected, the line in the middle pulled price back. And note the time — this is overnight, where most VWAP tools quietly stop working. Session-anchored means it works on Globex too.