Every print in the session lands on one of two sides — the ask (aggressive buyer) or the bid (aggressive seller). The indicator subtracts bid volume from ask volume at every price level, accumulates the net across the RTH session, and draws it as a horizontal profile anchored to the chart's right edge. Green bars mark levels where buyers dominated; red bars mark where sellers did. The wider the bar, the larger the imbalance.
!Requires the NinjaTrader OrderFlow+ add-on for volumetric (bid/ask) bar data. Details below →
NinjaTrader's volumetric feed splits every print into two buckets: ask volume (the aggressor bought) and bid volume (the aggressor sold). The indicator subtracts the bid from the ask at every price tick, accumulates the running total from the session open (09:30 ET) onward, and stores one number per price level — the session's net delta at that price. Then it renders that profile as horizontal bars on the right edge of the chart. Green bars point inward from levels where buyers dominated; red bars point inward from levels where sellers did. Bar width scales to the largest imbalance of the session, so the story reads at a glance.
§ 02 · On Real ChartsEvidence, not marketing
The indicator, in the
wild.
Three ES sessions — confirmation when flow agrees with price, an anomaly cluster at one level, and a session where the flow flipped on the chart.
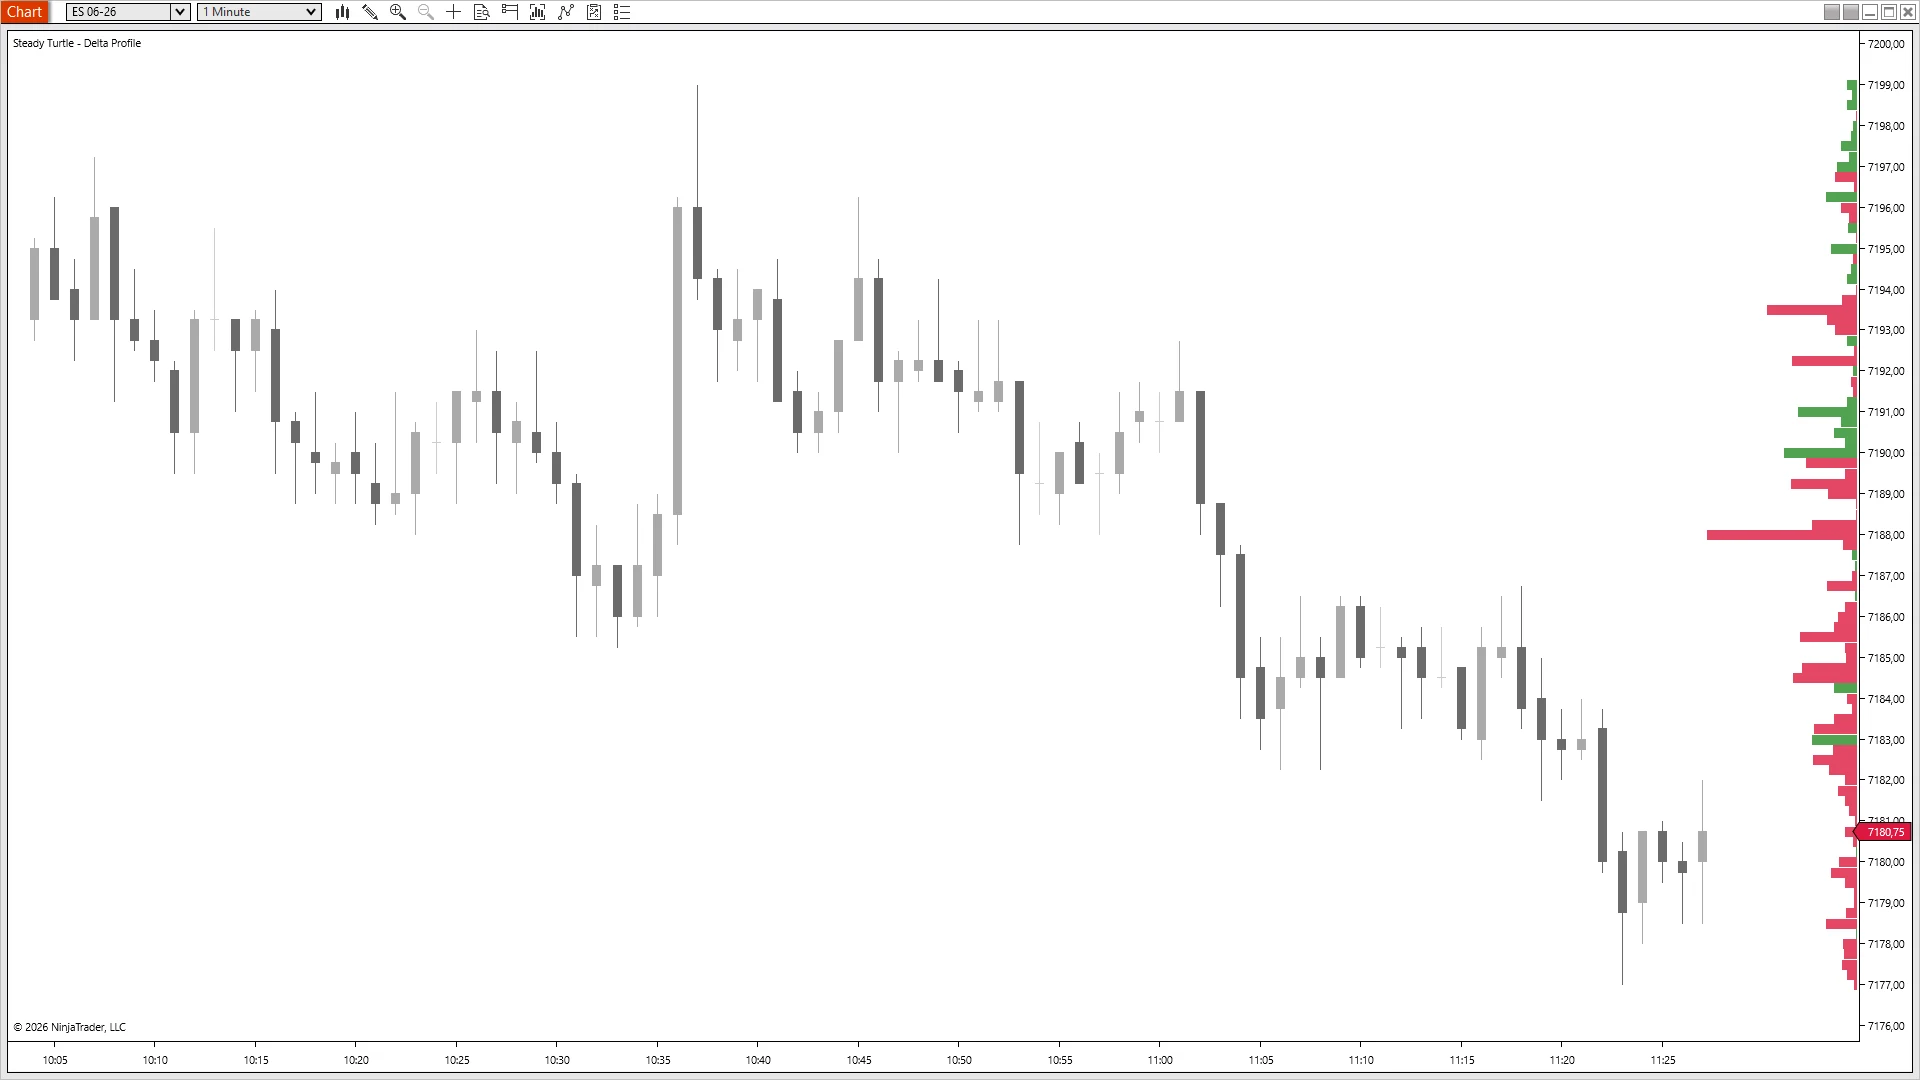
ES 06-26 · RTH · 1m
Move and
flow agreed.
Trend with size, not against it.
Price tags the high at 7200 around 10:35 and rolls — twenty-three points lower by 11:25, no meaningful bounce. The right-edge profile tells you why: it's red across the whole range. Heaviest bars at 7193 and 7188 where sellers leaned hardest, no green clusters fighting the move at any level. When trend and aggressor flow point the same way, the down-move is institutional, not retail capitulation. This is the gateway delta read — flow confirms what the candles say.
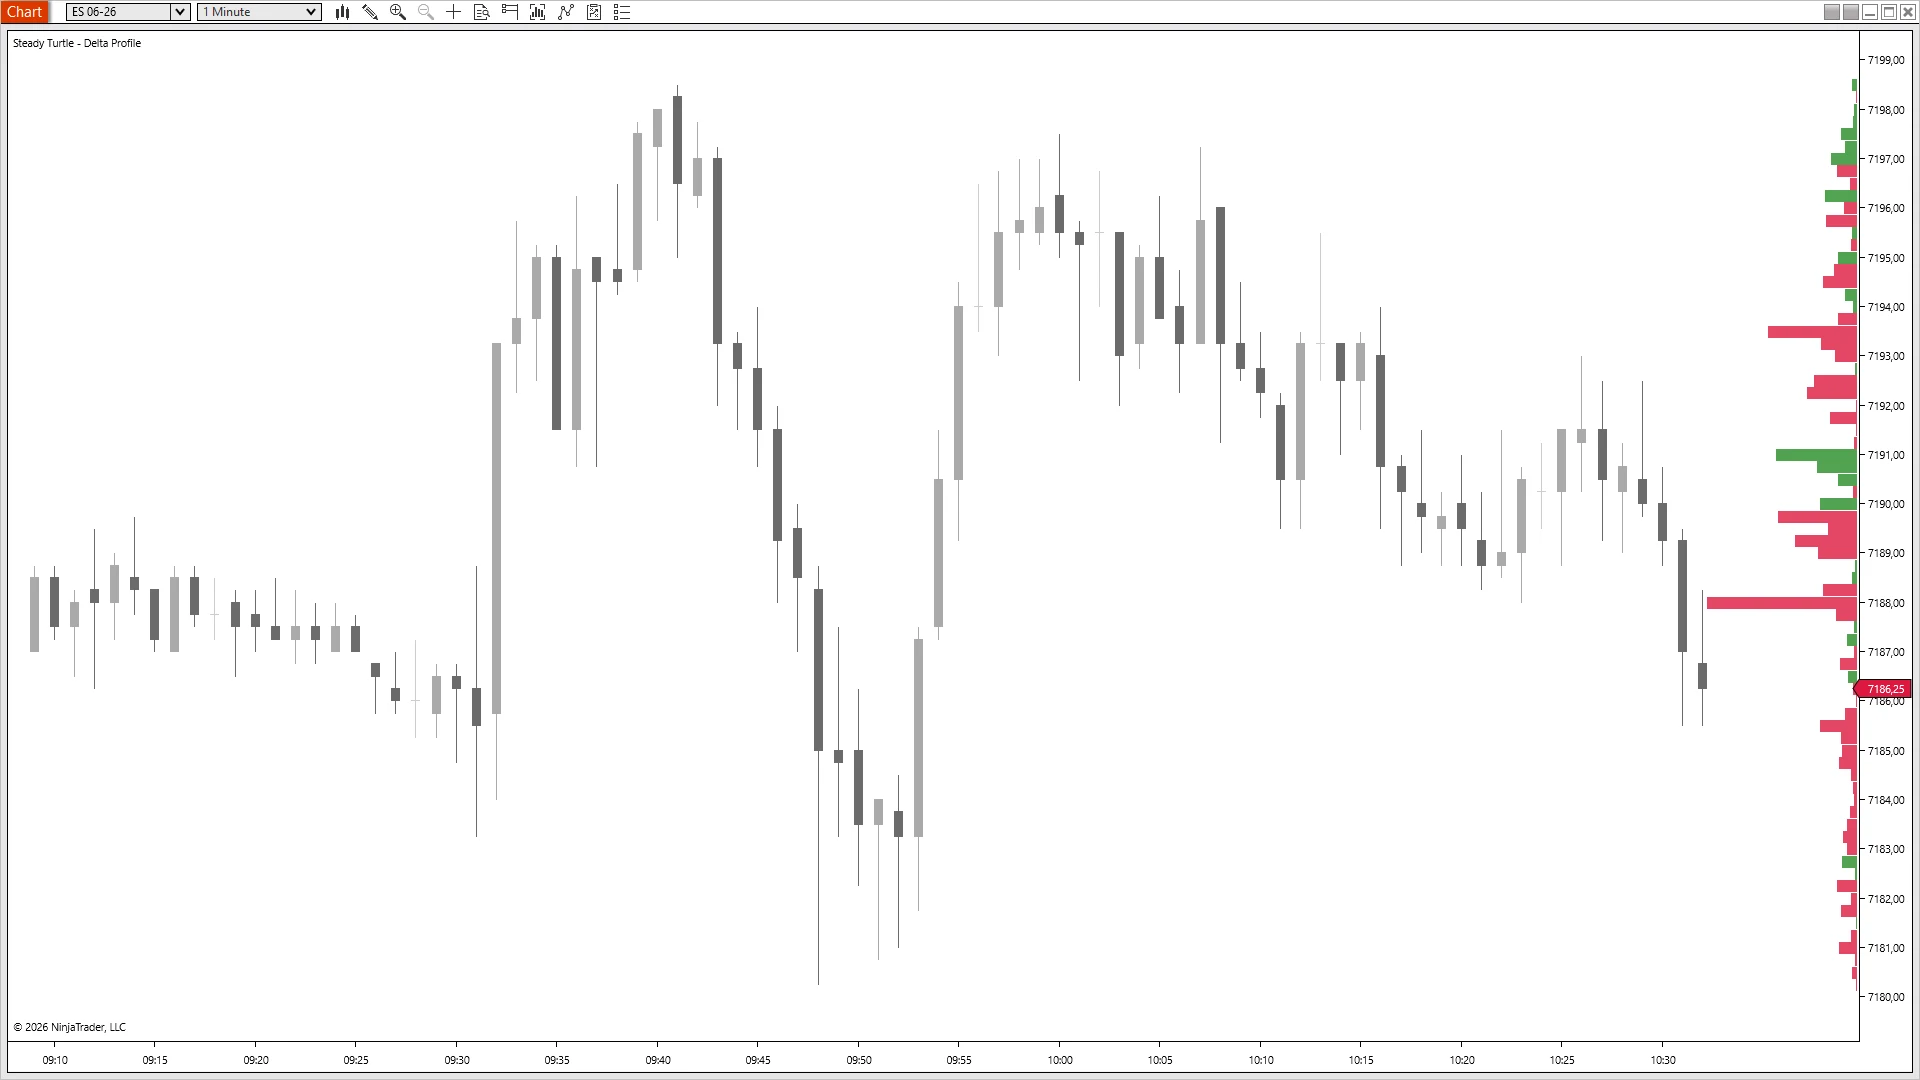
ES 06-26 · RTH · 1m
Where the size
showed up.
Most levels were quiet. One was not.
Price chops 7180–7199 for ninety minutes — multiple tests, no clear winner. The profile across that whole range stays modest: small red bars, small green bars, normal session noise. Except at 7188. The bar there extends three times longer than its neighbors — a single price where aggressive selling concentrated in size while everything around it stayed quiet. The chart didn't show this; only the cumulative delta did. That's the anomaly read: not <em>sellers were active</em> but <em>sellers were active here</em>, at this level, at scale.
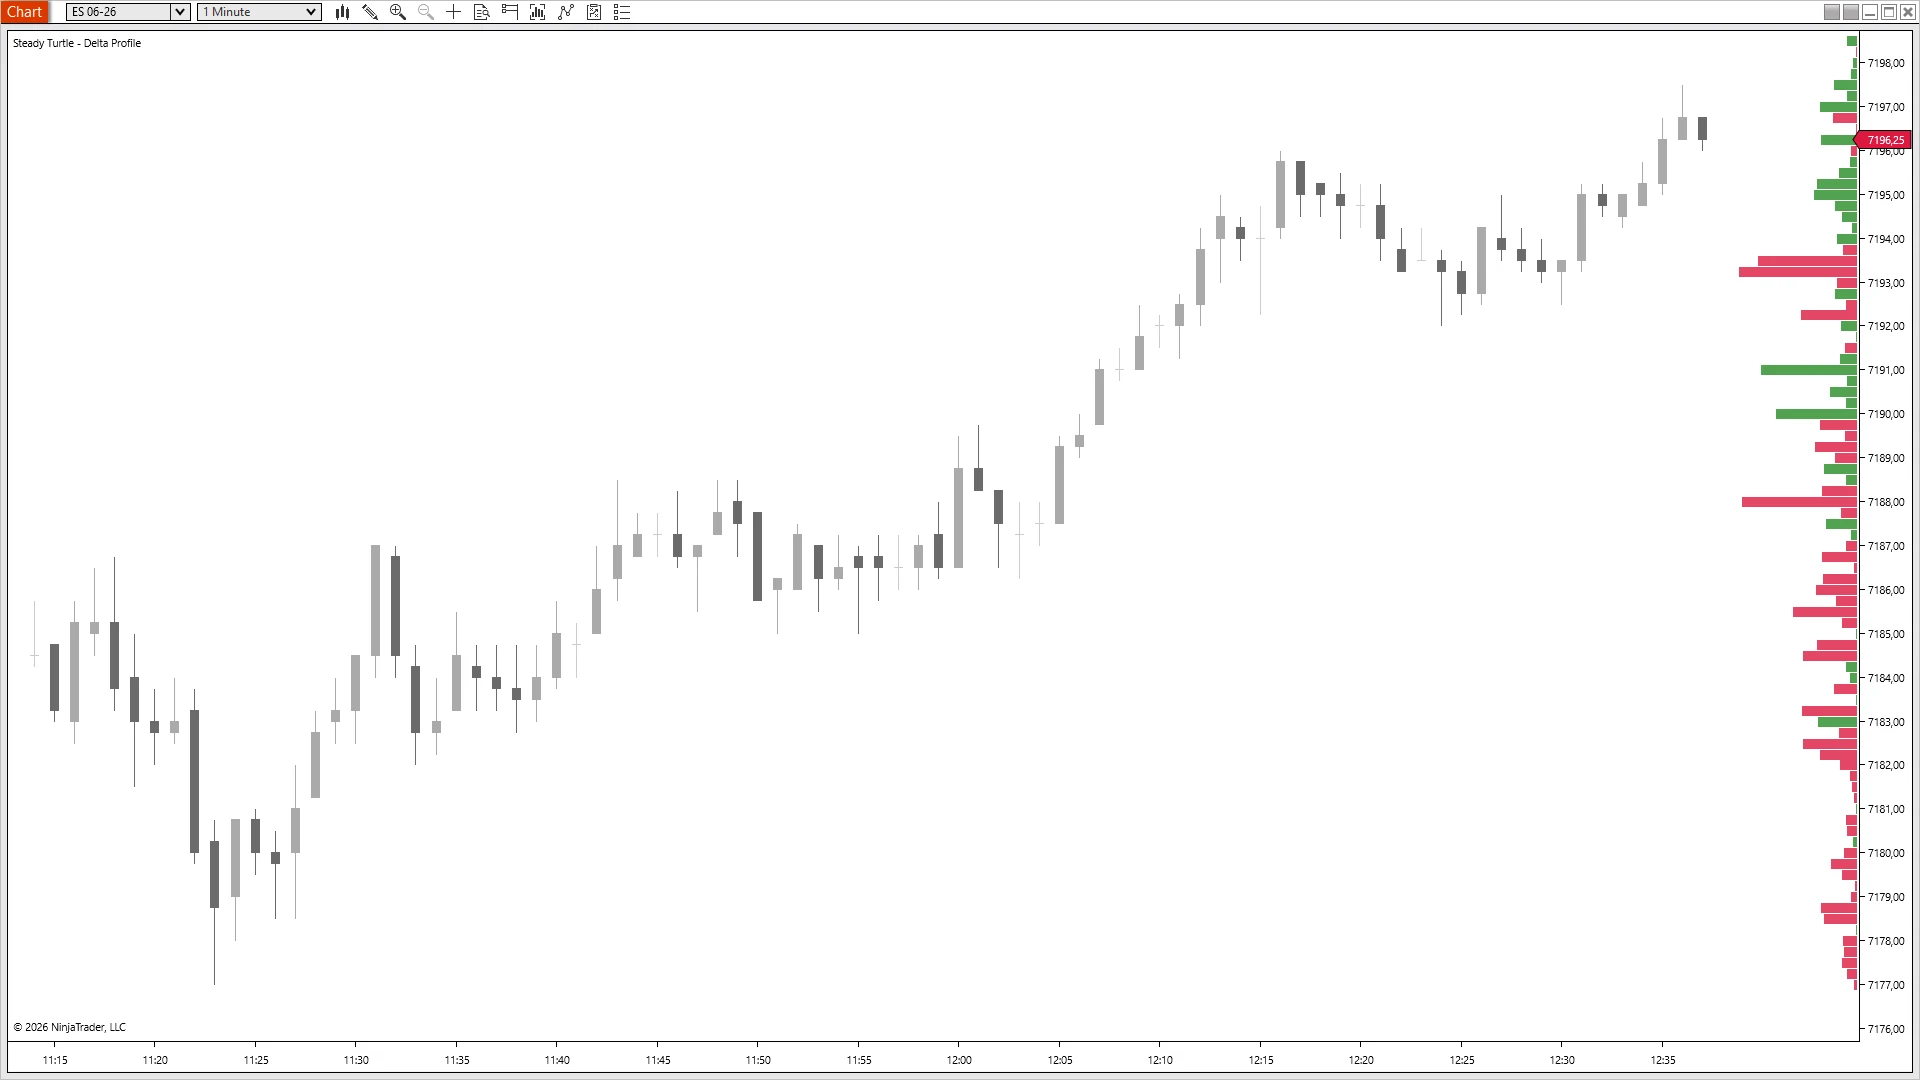
ES 06-26 · RTH · 1m
Where the flow
flipped.
Red below, green above. The pivot, on the chart.
Price bottoms at 7178 and walks up to 7198 over an hour. The profile reads the auction in two halves: every bar below 7194 prints red — sellers leaned and couldn't break the floor — and every bar above 7194 flips to green, where buyers took control of the tape. The exact price at which the auction pivoted is visible as a literal color change on the right edge. The candles told you the trend reversed; the profile tells you the price level it reversed at, and that the new flow is decisive.
§ 03 · The ReceiptsWhat traders say
What traders
actually
say.
Three quotes, three different reasons this one earned a slot in the workspace.
“
Been using volume profile forever but this opened my eyes. You can actually see when big players are absorbing at support levels. Those setups have been crazy profitable for me.
— Verified buyer
“
My breakout trades got way better after getting this. If delta isn't expanding with the move, I just don't take it anymore. Saved me from so many fake breakouts.
— Verified buyer
“
Use this with Volume Profile and it's a total game changer. Volume shows where they traded, delta shows who won. Both together just makes sense.
— Verified buyer
§ 04 · PricingOne-time · No discounts · No expiry
One indicator. Or everything.
The math writes itself. À la carte is $49. The bundle is $299 for everything — including every indicator I ship next year.
Everything traders ask me before they buy. If yours isn't here, email me →.
At every price tick that trades during the RTH session, NinjaTrader's volumetric feed tells you how many contracts hit the ask (aggressor bought) versus how many hit the bid (aggressor sold). The indicator subtracts bid volume from ask volume at each price, accumulates the running net across the session, and stores a single number per level — the session's delta at that price. The horizontal profile is just those numbers drawn as bars, anchored to the chart's edge.
Most delta tools plot delta over time — a histogram or line that updates bar by bar. Delta Profile plots delta over price — one value per price level, cumulative for the session. That changes what the tool tells you. A time-based delta indicator shows momentum; Delta Profile shows positioning — which prices the session accumulated into versus distributed out of.
Absorption is when price pushes into a level and the opposite-side flow absorbs the pressure — buyers keep buying everything sellers throw at them (or vice versa). On the profile, it shows as a large green bar at a level that price spent time below, or a large red bar at a level price pushed into from below. The pattern: directional candles meet a disproportionate delta in the opposite direction. That's where institutional positioning is defending a level.
Controls how finely the profile is binned. 1 tick per level (default) draws one bar per tick — highest resolution, busiest profile. 4 ticks per level groups every four ticks into a single bar — smoother picture of major zones. For scalping, stay at 1. For intraday structural reads, 4 – 10 cleans the profile up considerably.
Yes — OrderFlow+ is required. The indicator reads bid/ask volume from NinjaTrader's Volumetric bars, and Volumetric bars are an OrderFlow+ feature in NT8. Without the OrderFlow+ add-on enabled on your NinjaTrader license, the bid/ask data the indicator depends on simply isn't available — the profile will draw empty no matter which data feed you use. If you don't have OrderFlow+ yet, please don't buy this indicator: it has nothing to display. You can check whether you have it under Help → About in NinjaTrader, or by trying to add a "Volumetric" bar type to a chart. If your chart uses Renko, Point & Figure, Line Break, or Kagi bars, the indicator automatically falls back to a 1-minute volumetric series for the delta source — but that series still needs OrderFlow+ to populate.
Yes, Delta Profile is fully independent. The two answer different questions — Volume Profile shows where price traded, Delta Profile shows who won at those levels. Running both stacked on the same chart is the most common setup among traders who use both.
Any instrument NT8 can chart with real bid/ask volume — ES, MES, NQ, MNQ, YM, RTY, CL, GC, and most major futures. Especially effective on the index and energy futures where institutional volumetric data is deepest.
Yes, every edition — Free NT8, NT8 Lifetime License, and every tier in between. The only requirement is NinjaTrader 8 version 8.1.6 or newer — that's the build where NinjaTrader introduced email-based licensing, which the indicator uses to authenticate. Older builds can't authenticate; update via NT8's Control Center → Help → Check for Updates first if you're on an earlier version.
Yes — anywhere you sign in to NinjaTrader 8 with your user email. The license is tied to your NT8 user, not the machine, so desktop, laptop, and VPS all work the same. One user, unlimited machines.
Yes, lifetime updates. Every new version is free forever. If you buy the Complete Bundle, every future indicator I ship is also included at no extra cost.
Indicators are non-refundable — once you download, the software is yours to keep. Two ways to de-risk before buying: (a) try any of the free indicators first to confirm they load and run on your setup, and (b) email me with any pre-purchase questions at info@steady-turtle.com.
§ 06 · Settings ReferenceFor the record
Every knob,
exposed.
A configurable session window, a resolution knob for the profile, and color pairs for positive and negative delta. Here's what ships in the settings panel.
Name
Default
What it does
Session Start Time (ET)
09:30
When delta accumulation begins each day. Default is the cash open.
Session End Time (ET)
16:00
When delta accumulation stops. Default is the RTH close. Supports overnight sessions — set Start later than End (e.g. 20:00 start, 16:00 end) to track Globex sessions that span midnight.
Profile Width
150
Maximum width of the profile bars in pixels (50 – 500). Larger values make the profile more prominent; smaller values leave more chart space for price action.
Anchor
Right
Which chart edge the profile is anchored to — Right (default) or Left. Bars extend inward toward the price action.
Ticks Per Level
1
How many ticks are clustered into one profile bar (1 – 100). Default 1 = maximum resolution. Raise to 4 or 10 for cleaner profiles at the cost of granularity.
Positive Delta Color
ForestGreen
Color for bars at levels where buyers were dominant (net positive delta).
Negative Delta Color
Crimson
Color for bars at levels where sellers were dominant (net negative delta).
Profile Opacity
80
Profile fill opacity (10 – 100). Lower values let the price action show through; higher values keep the profile punchy.
Debug Mode
False
Print diagnostic info to the NinjaScript output window. Off unless you are troubleshooting.
$49 buys the indicator. $299 buys everything — plus every one I ship next year. Either way, one payment, no subscription, and it runs wherever you log into NinjaTrader.
Futures and forex trading contains substantial risk and is not for every investor. An investor could potentially lose all or more than the initial investment. Risk capital is money that can be lost without jeopardizing ones' financial security or life style. Only risk capital should be used for trading and only those with sufficient risk capital should consider trading. Past performance is not necessarily indicative of future results.
Testimonials appearing on this website may not be representative of other clients or customers and is not a guarantee of future performance or success.
Hypothetical Performance Disclosure
Hypothetical performance results have many inherent limitations, some of which are described below. No representation is being made that any account will or is likely to achieve profits or losses similar to those shown; in fact, there are frequently sharp differences between hypothetical performance results and the actual results subsequently achieved by any particular trading program. One of the limitations of hypothetical performance results is that they are generally prepared with the benefit of hindsight. In addition, hypothetical trading does not involve financial risk, and no hypothetical trading record can completely account for the impact of financial risk of actual trading. For example, the ability to withstand losses or to adhere to a particular trading program in spite of trading losses are material points which can also adversely affect actual trading results. There are numerous other factors related to the markets in general or to the implementation of any specific trading program which cannot be fully accounted for in the preparation of hypothetical performance results and all which can adversely affect trading results.