Every session open gets a fresh set of volatility bands — computed from the last ninety days of how this instrument actually moves at this hour, on this day, from this kind of open. One, two sigma, up and down. When price tags the outer band, the math already told you it was stretched.
Standard deviation isn't a guess — it's a count. Ninety days of net hourly moves, sorted by hour-of-day, then reduced to one sigma per slot. The bands you see at today's open aren't arbitrary; they're the shape of how this instrument has actually behaved at this clock time, with ±1σ covering roughly two-thirds of those moves and ±2σ covering ninety-five percent.
§ 02 · On Real ChartsEvidence, not marketing
The bands,
in practice.
Three live MNQ sessions, three roles the same bands played — fade target, two-timeframe stack, and a fresh anchor every hour.
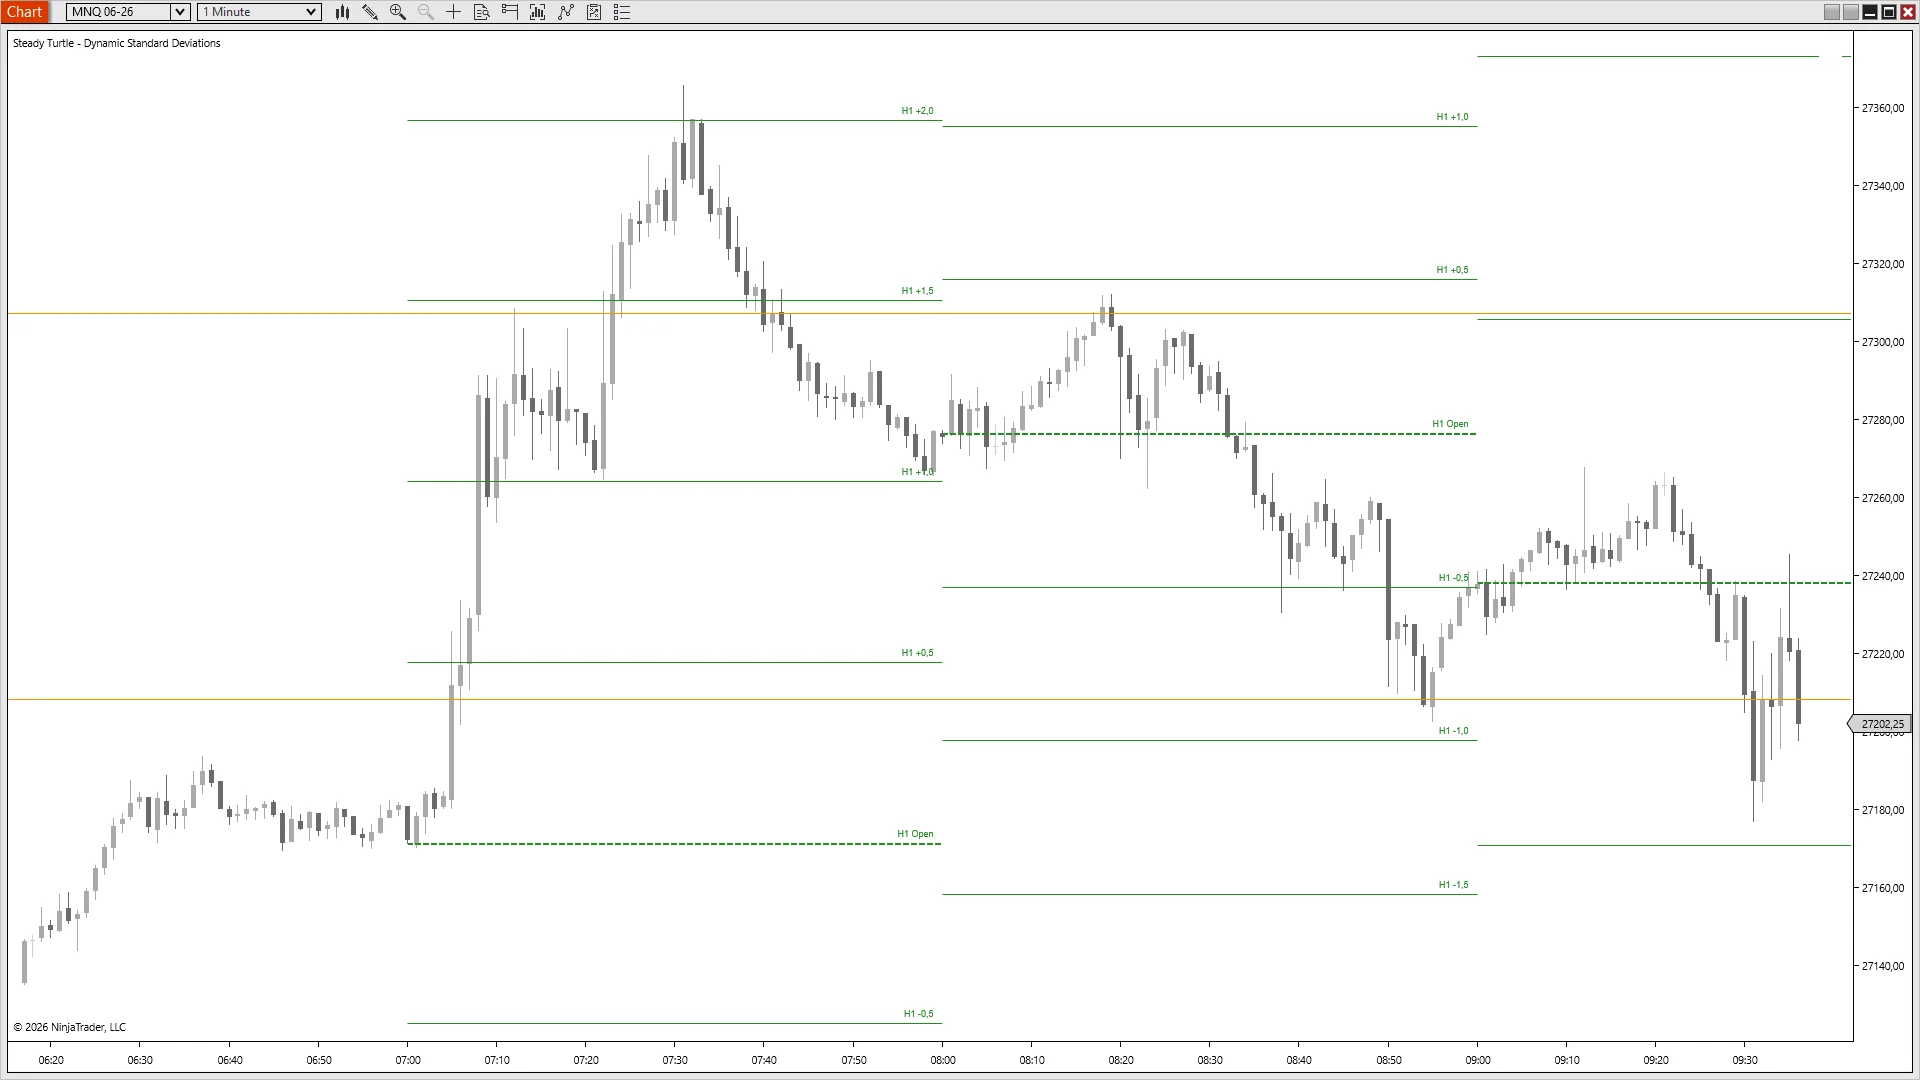
MNQ 06-26 · Premarket · 1m
The 2.0σ that
held.
Tagged the outer, nowhere else to go.
MNQ launches off the H1 Open and walks straight up through +0.5σ, +1.0σ, +1.5σ, and finally tags +2.0σ near 27360. That's a two-standard-deviation move — the kind that prints in roughly five percent of sessions at this hour. The very next candle wicks the level, rejects, and unwinds back through every band it just broke. You didn't need a pattern to know the move was stretched; the math drew the line.
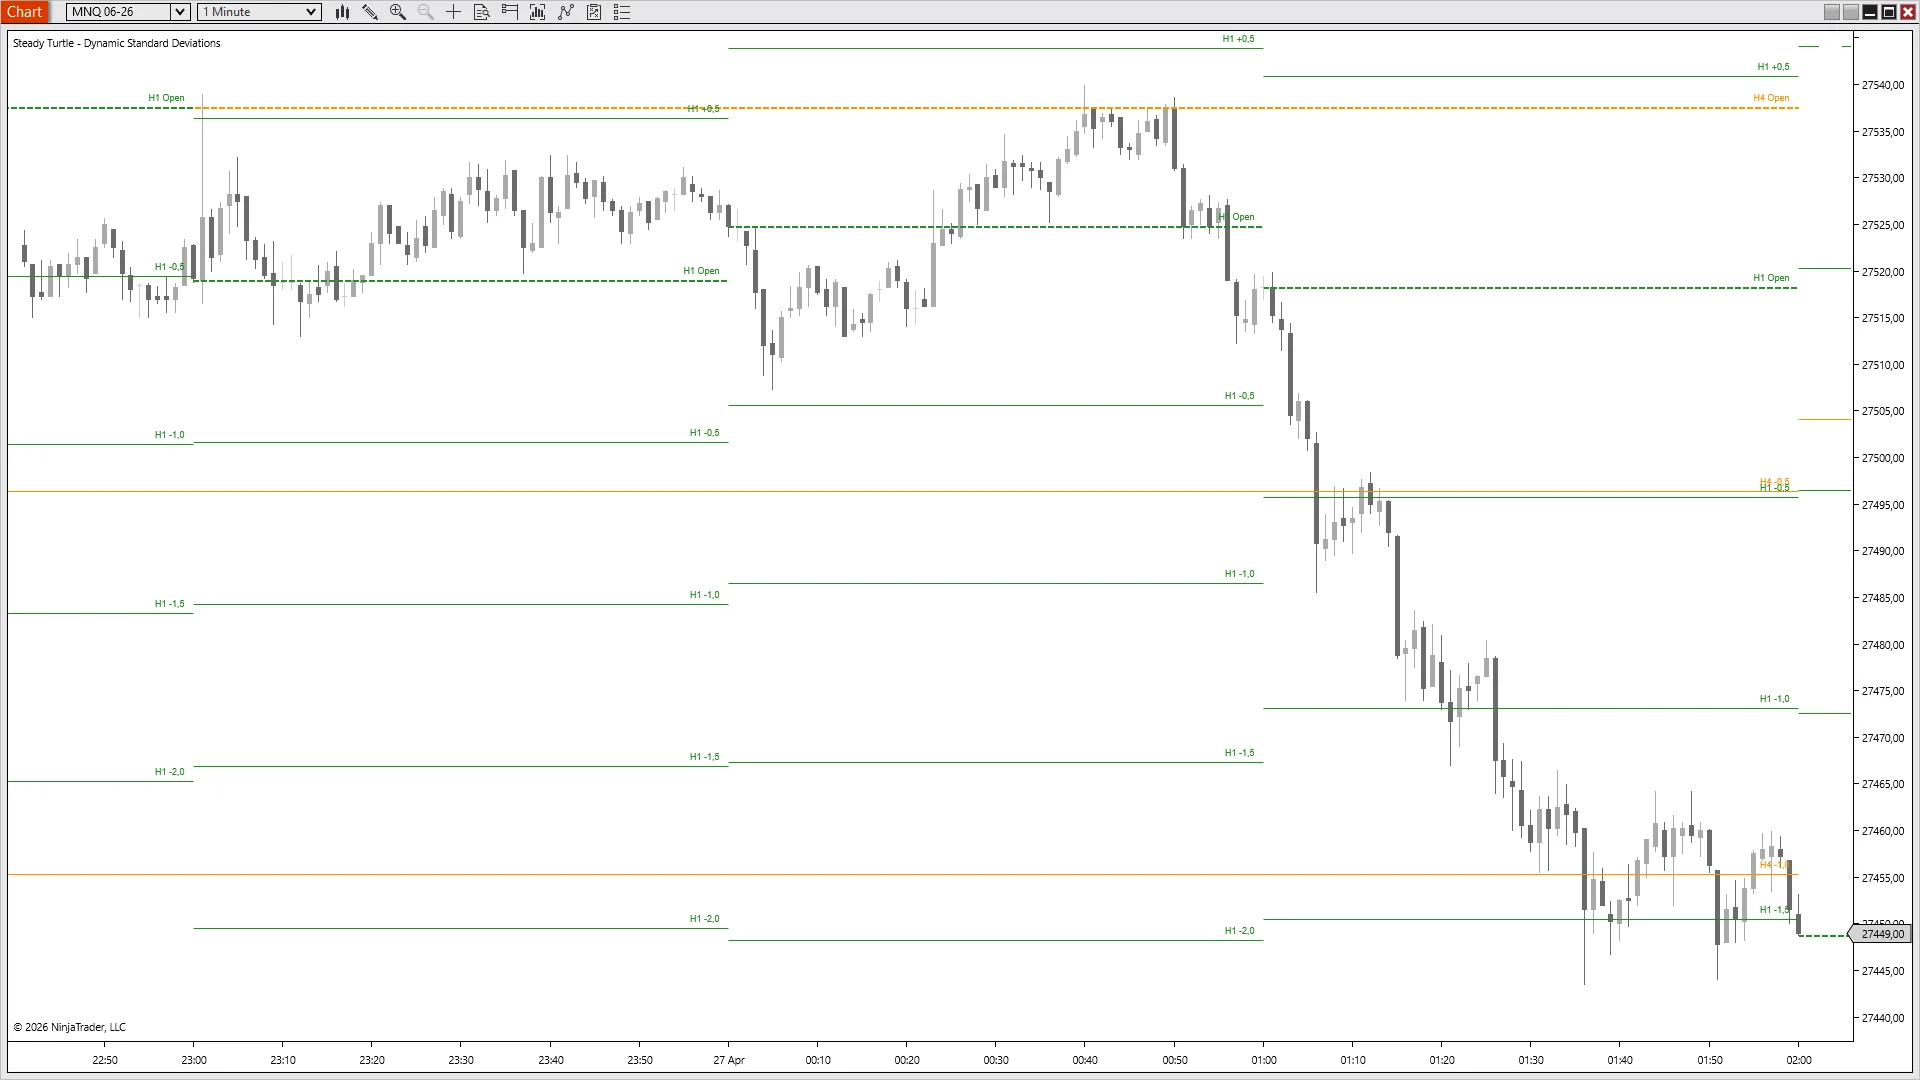
MNQ 06-26 · Overnight · 1m
H4 said no.
H1 walked down.
Why multi-timeframe matters.
Watch the orange H4 Open near 27538: every push tags it and rolls back over. With the higher-timeframe ceiling locked in, the H1 bands turn into the path of least resistance — price loses the H1 Open, takes -0.5σ, -1.0σ, -1.5σ, -2.0σ in sequence, and only stalls when it reaches the H4 -1.0σ band below. Two clocks on one chart: the H4 levels frame the trade, the H1 levels mark each step.
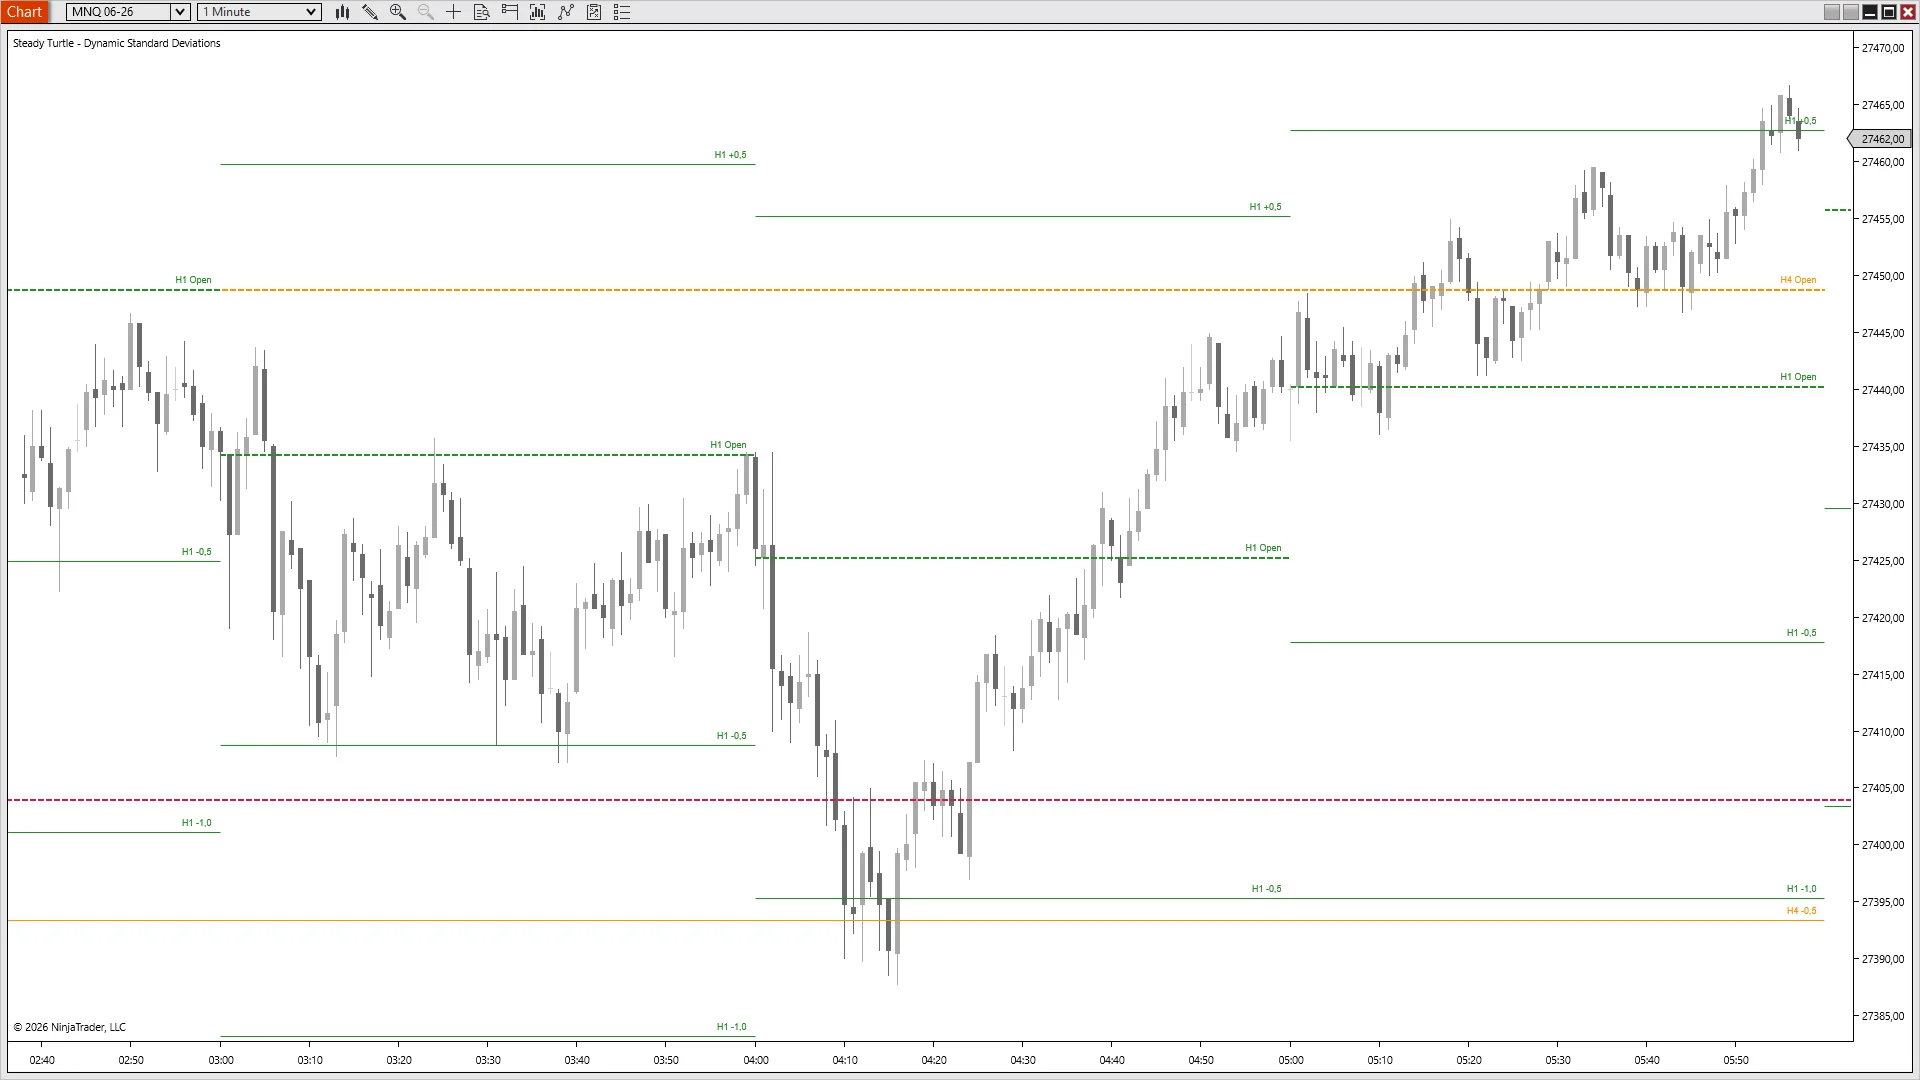
MNQ 06-26 · Globex · 1m
Fresh σ at every
hour open.
The math re-anchors every hour.
Three H1 sessions stitched together. Each hour open prints a new dashed pivot and a fresh set of σ bands radiating from it; the previous slot's bands stay drawn so the handoff is visible. Price drifts down into the first hour's -1.0σ at the H4 -0.5σ confluence near 27390, reverses, and by the third hour it's pressing the new +0.5σ. One indicator, always working off the freshest open.
§ 03 · The ReceiptsWhat traders say
What traders
actually
say.
No curated five-star walls. Three quotes, three different reasons this one stays on the chart.
“
The per-hour math is what sold me. Before this I was using Bollinger Bands that were way too wide overnight and way too tight at the open. These actually reflect when the market moves.
— Verified buyer
“
I fade the 2.0σ bands on NQ as my main setup. Doesn't work every time obviously, but when price runs straight into that crimson line after a one-way move, the reversal odds are real.
— Verified buyer
“
Ditched three other volatility indicators for this one. The multi-timeframe stacking — daily context, 4-hour targets, hourly triggers — is exactly how I was already thinking about the chart.
— Verified buyer
§ 04 · PricingOne-time · No discounts · No expiry
One indicator. Or everything.
The math writes itself. À la carte is $49. The bundle is $299 for everything — including every indicator I ship next year.
Everything traders ask me before they buy. If yours isn't here, email me →.
It's a count, not a guess. The indicator takes the last ninety days of net price moves at each hour slot, then measures how much those moves typically vary from their average. One sigma (±1σ) covers about sixty-eight percent of those historical moves; two sigma (±2σ) covers about ninety-five percent. When price sits near the ±1σ band, it's doing what the last ninety days said it would. When it pokes through ±2σ, it's in the outer five percent of how this instrument behaves at this hour.
Every night at the session rollover (18:00 ET), the lookback window slides one day forward. Yesterday's data gets added, day ninety-one drops off, and a fresh σ gets computed for every slot. That's why the bands quietly widen in high-volatility regimes and contract in quiet ones — you don't have to re-tune anything, and the levels never reflect a market that no longer exists. You can set the lookback anywhere from 1 to 365 days in settings.
Because a single daily σ is a lie-by-averaging. The 22:00–02:00 ET Asia block and the 09:30–10:30 ET US open have completely different volatility footprints — using one number for both overstates overnight and understates the cash open. The indicator keeps twenty-four hourly slots and six 4-hour slots so each band reflects the clock time it's projected from. Daily (D1) uses one slot, because by definition a day is a day.
Bollinger Bands anchor to a moving average that drifts with price, so the bands move every bar — they can't act as fixed levels. These bands anchor to the session open and stay put for the duration of the session, so alerts, stops, and targets can be planted at a specific price. Bollingers also use one σ across all hours; this indicator has thirty-one distinct σ values (24 H1 + 6 H4 + 1 D1). Different tool, different job.
Any liquid futures instrument NT8 can chart — ES, NQ, MES, MNQ, CL, GC, 6E, and so on. The math needs enough historical hourly data to fill the lookback window, so it works best on instruments with round-the-clock volume. Equities and FX work too, though session-gapped data will shift the interpretation of the overnight slots.
Yes, every edition — Free NT8, NT8 Lifetime License, and every tier in between. The only requirement is NinjaTrader 8 version 8.1.6 or newer — that's the build where NinjaTrader introduced email-based licensing, which the indicator uses to authenticate. Older builds can't authenticate; update via NT8's Control Center → Help → Check for Updates first if you're on an earlier version.
Yes — anywhere you sign in to NinjaTrader 8 with your user email. The license is tied to your NT8 user, not the machine, so desktop, laptop, and VPS all work the same. One user, unlimited machines.
Yes, lifetime updates. Every new version is free forever. If you buy the Complete Bundle, every future indicator I ship is also included at no extra cost.
Indicators are non-refundable — once you download, the software is yours to keep. Two ways to de-risk before buying: (a) try any of the free indicators first to confirm they load and run on your setup, and (b) email me with any pre-purchase questions at info@steady-turtle.com.
§ 06 · Settings ReferenceFor the record
Every knob,
exposed.
For the traders who need to know every knob before buying — here's what ships in the settings panel, and what it does.
Name
Default
What it does
Lookback Days
90
Number of days of history used for the σ calculation. Configurable 1–365; 90 is the default balance between statistical significance and market relevance.
Historic Periods to Show
24
How many past periods to keep drawn on the chart per timeframe, 1–168. Higher values are useful for backtesting by eye.
Show 0.5 SD
True
Toggle the ±0.5σ band. The innermost envelope — where price lives roughly forty percent of the time.
Show 1.0 SD
True
Toggle the ±1.0σ band. Roughly sixty-eight percent of historical moves fall inside this zone.
Show 1.5 SD
True
Toggle the ±1.5σ band. A useful intermediate target between ±1σ and ±2σ.
Show 2.0 SD
True
Toggle the ±2.0σ band. Roughly ninety-five percent of moves fall inside; tags are statistically extended.
Show H1 Levels
True
Draw hourly bands — one σ per hour-of-day slot, projected from the last hourly open.
H1 Line Color
Yellow
Color of the H1 σ band lines.
H1 Label Color
Yellow
Color of the H1 band labels.
Show H4 Levels
True
Draw 4-hour bands — one σ per 4-hour slot, projected from the last 4-hour open.
H4 Line Color
DarkOrange
Color of the H4 σ band lines.
H4 Label Color
DarkOrange
Color of the H4 band labels.
Show D1 Levels
True
Draw daily bands — one σ over all days, projected from the 18:00 ET session open.
D1 Line Color
Crimson
Color of the D1 σ band lines.
D1 Label Color
Crimson
Color of the D1 band labels.
Open Line Style
Dash
Dash style for the session-open pivot line, visually distinct from the σ bands.
Open Line Width
2
Pixel width of the session-open line, 1–10.
SD Line Style
Solid
Dash style used for the ±0.5/1/1.5/2σ bands.
SD Line Width
1
Pixel width of the σ band lines, 1–10.
While you're hereOften paired with Dynamic StDev Bands
$49 buys the indicator. $299 buys everything — plus every one I ship next year. Either way, one payment, no subscription, and it runs wherever you log into NinjaTrader.
Futures and forex trading contains substantial risk and is not for every investor. An investor could potentially lose all or more than the initial investment. Risk capital is money that can be lost without jeopardizing ones' financial security or life style. Only risk capital should be used for trading and only those with sufficient risk capital should consider trading. Past performance is not necessarily indicative of future results.
Testimonials appearing on this website may not be representative of other clients or customers and is not a guarantee of future performance or success.
Hypothetical Performance Disclosure
Hypothetical performance results have many inherent limitations, some of which are described below. No representation is being made that any account will or is likely to achieve profits or losses similar to those shown; in fact, there are frequently sharp differences between hypothetical performance results and the actual results subsequently achieved by any particular trading program. One of the limitations of hypothetical performance results is that they are generally prepared with the benefit of hindsight. In addition, hypothetical trading does not involve financial risk, and no hypothetical trading record can completely account for the impact of financial risk of actual trading. For example, the ability to withstand losses or to adhere to a particular trading program in spite of trading losses are material points which can also adversely affect actual trading results. There are numerous other factors related to the markets in general or to the implementation of any specific trading program which cannot be fully accounted for in the preparation of hypothetical performance results and all which can adversely affect trading results.