NinjaTrader's ATM display only shows tick distance. This indicator reads your stop and targets, converts them to dollars, points, R-multiples, and a live risk/reward ratio, then draws a dynamic break-even line that advances as you scale out. The daily drawdown limit you're trading against isn't measured in ticks.
▲Enter your full size on the entry, then scale out via the ATM’s limit orders. Adding contracts after breaks the math. Why →
Or get all 12 in the Complete Bundle · $299 · see pricing →
NQ 06-26
1m5m15mRTH
O 19820 · H 19854 · L 19808 · C 19842
● NinjaTrader 8 Workspace · Profit Forecast LoadedATM · Active Position
Your profit,
forecast
live.
Every bar, the indicator reads your active ATM strategy, the stop, every profit target, the entry, then multiplies tick distance by the instrument's tick value and the number of contracts to get dollars. Divide by your configured 1R to get R-multiples. Sum what's already been banked from partials, and the break-even line advances to reflect the profit you've locked in. Nothing you couldn't do in a spreadsheet; the point is not having to.
The numbers,
in practice.
One MNQ short, three moments, the multi-target setup at fill, the first partial flipping the trade risk-free, and the runner sitting on $100 in locked-in profit.
The stakes
before the click.
MNQ 06-26 · Live ATMNinjaTrader 8 · live session
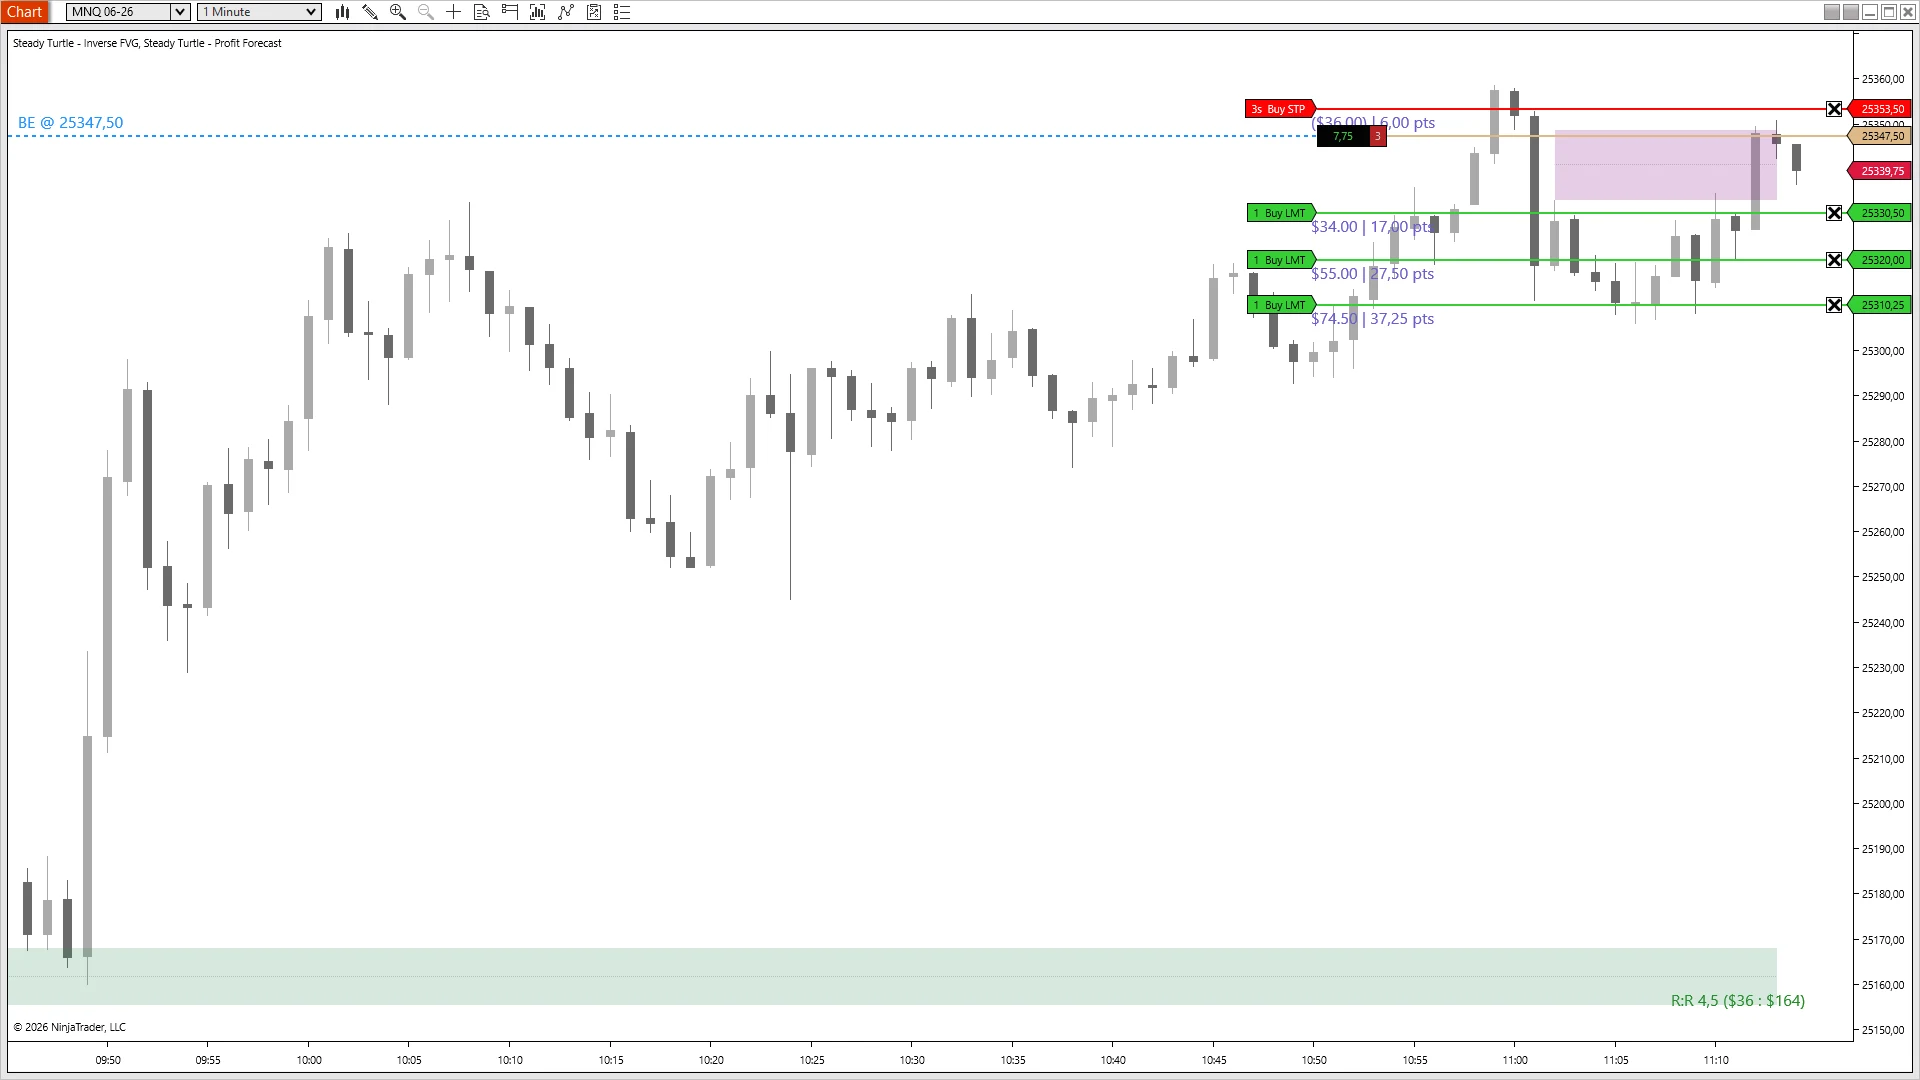
One stop, three targets, every line priced.
A short loads at 25347.50 with a 6-point stop at 25353.50 and three scaled targets stepping down to 25310.25. The stop label reads $36.00 | 6.00 pts; T1 is $34.00 | 17.00 pts, T2 is $55.00 | 27.50 pts, T3 is $74.50 | 37.25 pts. The corner panel sums it: R:R 4.5 ($36 : $164). Risk and reward, on the same screen as the candle, before the fill prints.
T1 fills.
Risk-free.
MNQ 06-26 · Live ATMNinjaTrader 8 · live session
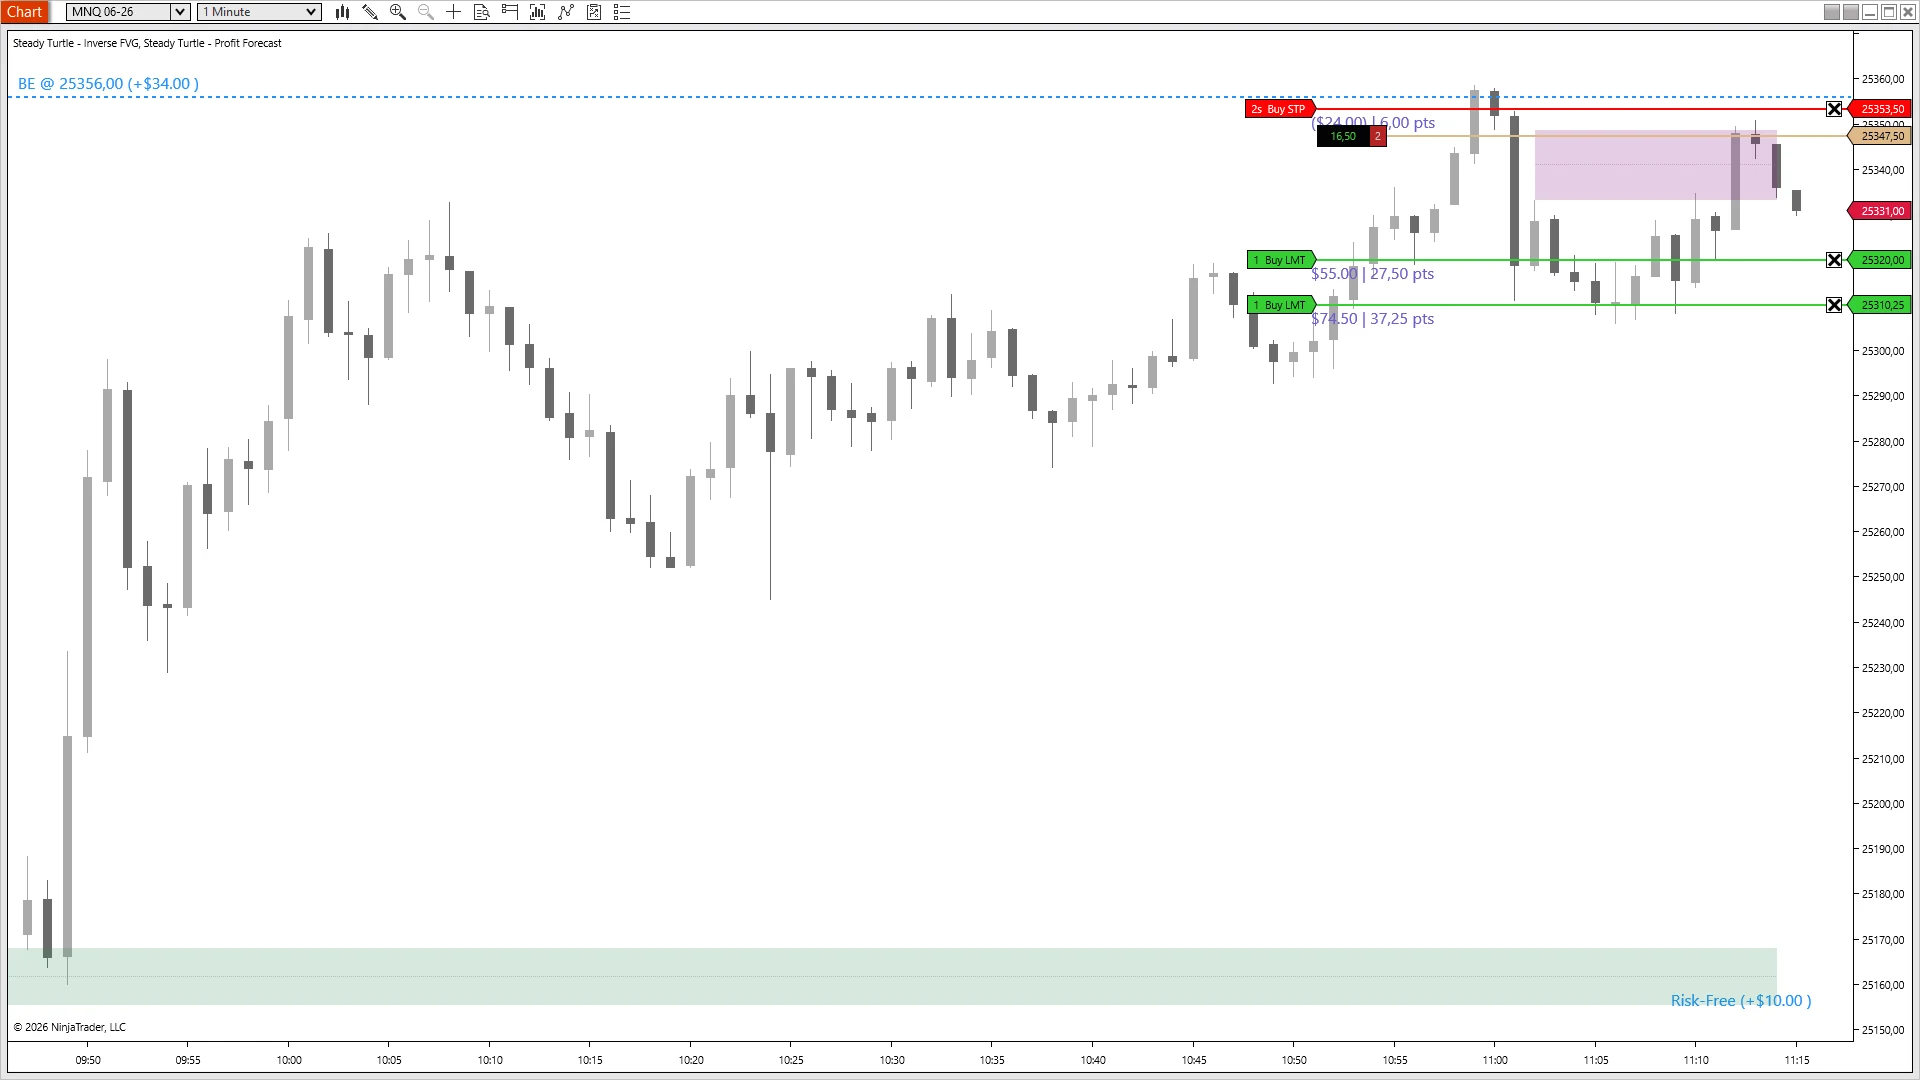
The pivot moment, on the chart.
The first target fills, one contract banks $34, and the dashed BE line snaps from 25347.50 up to 25356.00. That's the price where the two remaining contracts can exit flat for the whole trade. Bottom-right flips from green R:R to Risk-Free (+$10.00). Past this candle, the worst case is breakeven plus ten bucks. The line tells you exactly where that floor sits, and it updates bar by bar as price ticks.
Banked $100,
runner free.
MNQ 06-26 · Live ATMNinjaTrader 8 · live session
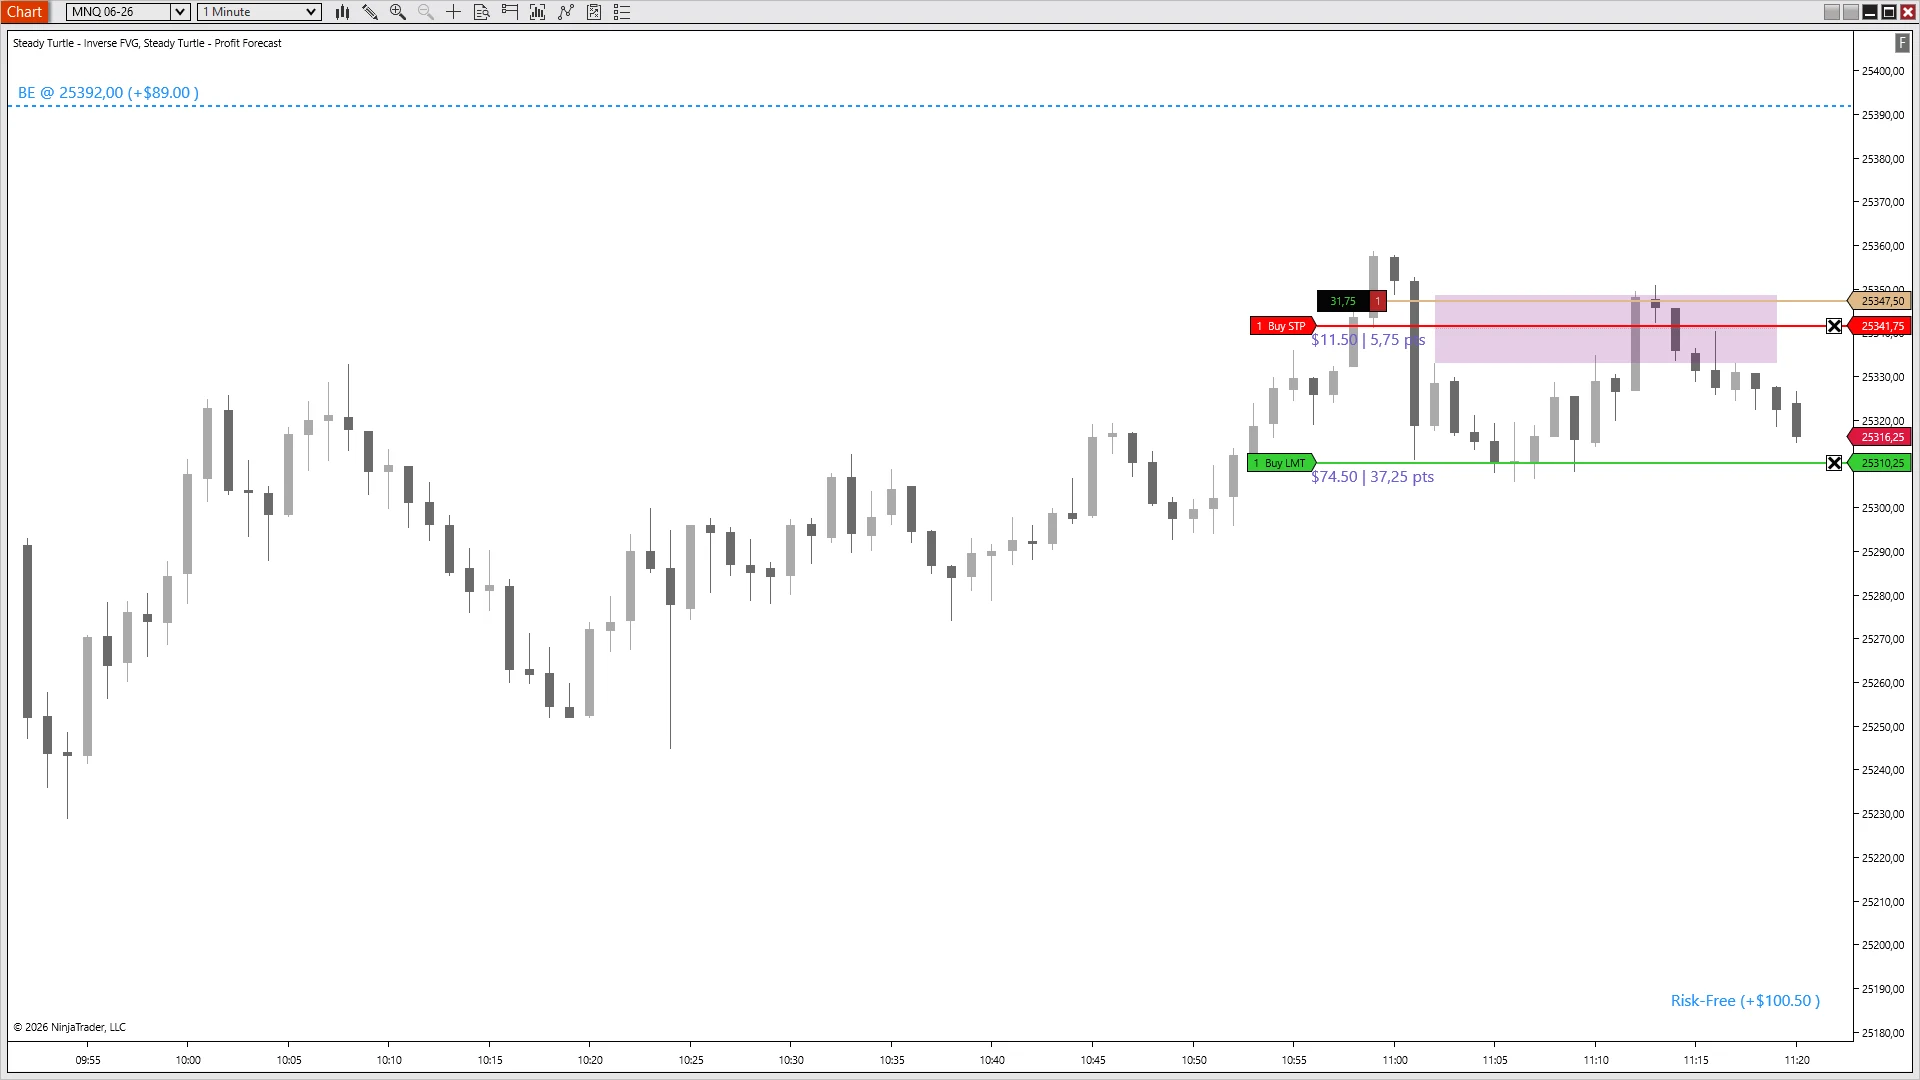
The line stops being a floor. It becomes a shelf.
Two more partials done. The BE line now sits at 25392.00, well above current price, and the corner reads Risk-Free (+$100.50). The remaining contract is in +31.75 points of unrealized profit on top of the $100 already banked. The dashed line isn't asking where you can get out flat anymore; it's telling you the worst-case payday for the trade. Press the runner, let it ride, or trail, every option is positive.
What traders
actually
say.
No curated five-star walls. Three quotes, three different reasons this one stays on the chart.
★★★★★
“Every tick matters when you've got a daily loss limit. Seeing exact dollar risk before I hit buy is the difference between a good Tuesday and getting my account paused. Not a single trade goes on without this now.”
Verified buyer
★★★★★
“The R-value display rewired how I think about trades. Seeing "+2.5R" instead of "+$625" makes it way easier to stay consistent across size changes. My risk discipline got obviously better.”
Verified buyer
★★★★★
“The dynamic break-even line is the feature. I scale in three legs, and watching that blue line advance after each partial tells me exactly when my last contract is a free trade. Pure clarity.”
Verified buyer
PricingOne-time · No discounts · No expiry
One indicator. Or everything.
À la carte is $49. The bundle is $299 for everything, including every indicator I ship next year.
Everything traders ask me before they buy. If yours isn't here, email me →.
No. Drop the indicator on the chart and trade with your existing ATM strategies as you already do, any custom ATM template works. The indicator detects your orders automatically and layers the P&L information on top. If you remove it, your ATM behavior is unchanged.
NT8's default ATM label shows tick distance and that's it. This indicator adds: exact dollar P&L per order, points and ticks together, R-multiples, a live color-coded R:R ratio, a dynamic break-even line that advances as you scale out, and a RISK-FREE flag with the locked-in dollar amount once partials cover your original stop.
1R is your standard risk unit, the dollar amount you're risking on a typical trade. Set it to whatever that number is for you ($250 is the default). Every P&L then displays as a multiple: $500 becomes +2R, $125 becomes +0.5R. Makes it easier to evaluate trades consistently across different position sizes.
The BE line is the price where the remaining position can exit at zero net P&L, accounting for profit already realized on partial fills. Before any target fills, BE sits at your entry. After T1 fills, the line jumps to the price that offsets the partial profit against the remaining contracts. As more targets fill, the line keeps moving, often past your original stop, at which point the panel flags RISK-FREE.
Yes. Each target is priced individually (dollars + R + ticks + points), and the aggregate R:R and break-even update as each level fills. If your ATM has three targets, you'll see three labeled lines; as each fills, that target's line drops off the chart, the BE line jumps to reflect the partial profit locked in, and the corner panel shows the realized P&L on the way to RISK-FREE.
No, enter your full size in one order, then scale out via the ATM. The indicator latches onto your ATM the moment the entry fills; that's when 1R, the targets, and the break-even line are anchored. Adding contracts later, even on the same ATM template, registers as a separate position from the indicator's perspective, so the math on the chart stops matching what's actually live. The whole flow is built the other direction: enter full size, then let the ATM's limit orders peel the position off at each target.
Prop firms enforce hard daily loss limits and trailing drawdown rules, and one miscalculated trade can end the session or the account. Seeing exact dollar risk before you click removes the mental-math step entirely. The RISK-FREE flag tells you when a runner can't hurt the day anymore, exactly the signal you need before deciding to press a move.
Any instrument you can trade via ATM in NT8, futures, forex, stocks, the indicator reads the tick size and point value automatically.
Yes, every edition, Free NT8, NT8 Lifetime License, and every tier in between. The only requirement is NinjaTrader 8 version 8.1.7 or newer. The indicator authenticates through NinjaTrader's email-based licensing, which needs a current build; older versions can't authenticate. Update via NT8's Control Center → Help → Check for Updates first if you're on an earlier version.
Yes, anywhere you sign in to NinjaTrader 8 with your user email. The license is tied to your NT8 user, not the machine, so desktop, laptop, and VPS all work the same. One user, unlimited machines.
Yes, lifetime updates. Every new version is free forever. If you buy the Complete Bundle, every future indicator I ship is also included at no extra cost.
Indicators are non-refundable, once you download, the software is yours to keep. Two ways to de-risk before buying: (a) try any of the free indicators first to confirm they load and run on your setup, and (b) email me with any pre-purchase questions at info@steady-turtle.com.
Every knob,
exposed.
For the traders who need to know every knob before buying, here's what ships in the settings panel, and what it does.
Name
Default
What it does
Show R Values
False
Display P&L as R-multiples alongside the dollar/point values.
Show USD
True
Display P&L in dollars on each ATM order label.
Show Points
True
Display P&L in points on each ATM order label.
Show Ticks
False
Display P&L in ticks on each ATM order label.
1R Value ($)
250
Dollar amount that represents your standard risk unit. Every R-multiple is computed relative to this.
Show Risk/Reward
True
Show the live R:R panel in the top-right corner.
Use R:R Colors
True
Color-code the R:R panel by quality tier. Turn off for a single neutral color.
Poor R:R Color (< 1.0)
OrangeRed
Panel color when the max-target R:R is below 1:1.
Acceptable R:R Color (1.0-2.0)
Gold
Panel color when R:R is 1:1 to 2:1.
Good R:R Color (>= 2.0)
LimeGreen
Panel color when R:R is 2:1 or better.
Risk-Free Color
DodgerBlue
Panel color when realized partials exceed the remaining stop risk, the position can no longer lose money on the day.
No Targets Color
Gray
Panel color when active stops exist but no remaining profit targets.
Hide USD Values
False
Swap the USD amounts in the R:R panel for R-multiples only. Useful if you trade by R, not by dollar.
R:R Display X-Offset
180
Horizontal offset of the R:R panel from the right edge, in pixels (50-500).
Show Break Even Line
True
Draw the dynamic break-even line. Updates each time a target fills.
Break Even Line Color
DodgerBlue
Stroke color for the break-even line.
Break Even Line Width
2
Pixel width of the break-even line.
Break Even Line Style
Dash
Dash style for the break-even line, solid, dash, dot.
Break Even Text Background Color
Transparent
Fill color behind the break-even price label.
Break Even Text Background Opacity
70
Opacity of the break-even label background, 1-100.
ATM Text Color
Goldenrod
Default color for ATM order text labels.
ATM Text Background Color
Transparent
Fill color behind each ATM order label.
ATM Text Background Opacity
70
Opacity of the ATM label backgrounds, 1-100.
Text Font
Lato 16
Font family and size for every label the indicator draws.
Debug Mode
False
Print debug info to the NinjaScript output window.
While you're hereOften paired with Profit Forecast
$49 buys the indicator. $299 buys everything, plus every one I ship next year. Either way, one payment, no subscription, and it runs wherever you log into NinjaTrader.
Futures and forex trading contains substantial risk and is not for every investor. An investor could potentially lose all or more than the initial investment. Risk capital is money that can be lost without jeopardizing ones' financial security or life style. Only risk capital should be used for trading and only those with sufficient risk capital should consider trading. Past performance is not necessarily indicative of future results.
Testimonials appearing on this website may not be representative of other clients or customers and is not a guarantee of future performance or success.
Hypothetical Performance Disclosure
Hypothetical performance results have many inherent limitations, some of which are described below. No representation is being made that any account will or is likely to achieve profits or losses similar to those shown; in fact, there are frequently sharp differences between hypothetical performance results and the actual results subsequently achieved by any particular trading program. One of the limitations of hypothetical performance results is that they are generally prepared with the benefit of hindsight. In addition, hypothetical trading does not involve financial risk, and no hypothetical trading record can completely account for the impact of financial risk of actual trading. For example, the ability to withstand losses or to adhere to a particular trading program in spite of trading losses are material points which can also adversely affect actual trading results. There are numerous other factors related to the markets in general or to the implementation of any specific trading program which cannot be fully accounted for in the preparation of hypothetical performance results and all which can adversely affect trading results.