The first hour writes the day. From 09:30 to 10:30, the session's real range gets built, not the hasty five-minute opening, but the full hour where institutional participation arrives. The indicator marks the Initial Balance the moment it locks, then fans out extension lines at 100%, 200%, 300% (and beyond) of its width. Every extension is a target the rest of the day trades against. Prefer a 30-minute IB? Change one setting; the math follows.
From 09:30 to 10:30 the session builds its real range, the Initial Balance, in market-profile language. The indicator freezes the IB at the hour mark, then fans out extension lines at 100%, 200%, 300%, 400%, and 500% of the IB width (above and below). Every line is a target the remaining five hours of RTH trade against, breakouts run to +100% first, trend days reach +200% or +300%, and the rare sessions that tag +500% are the ones you remember. Prefer a 30 or 90-minute IB? Configurable, the extensions recalculate automatically.
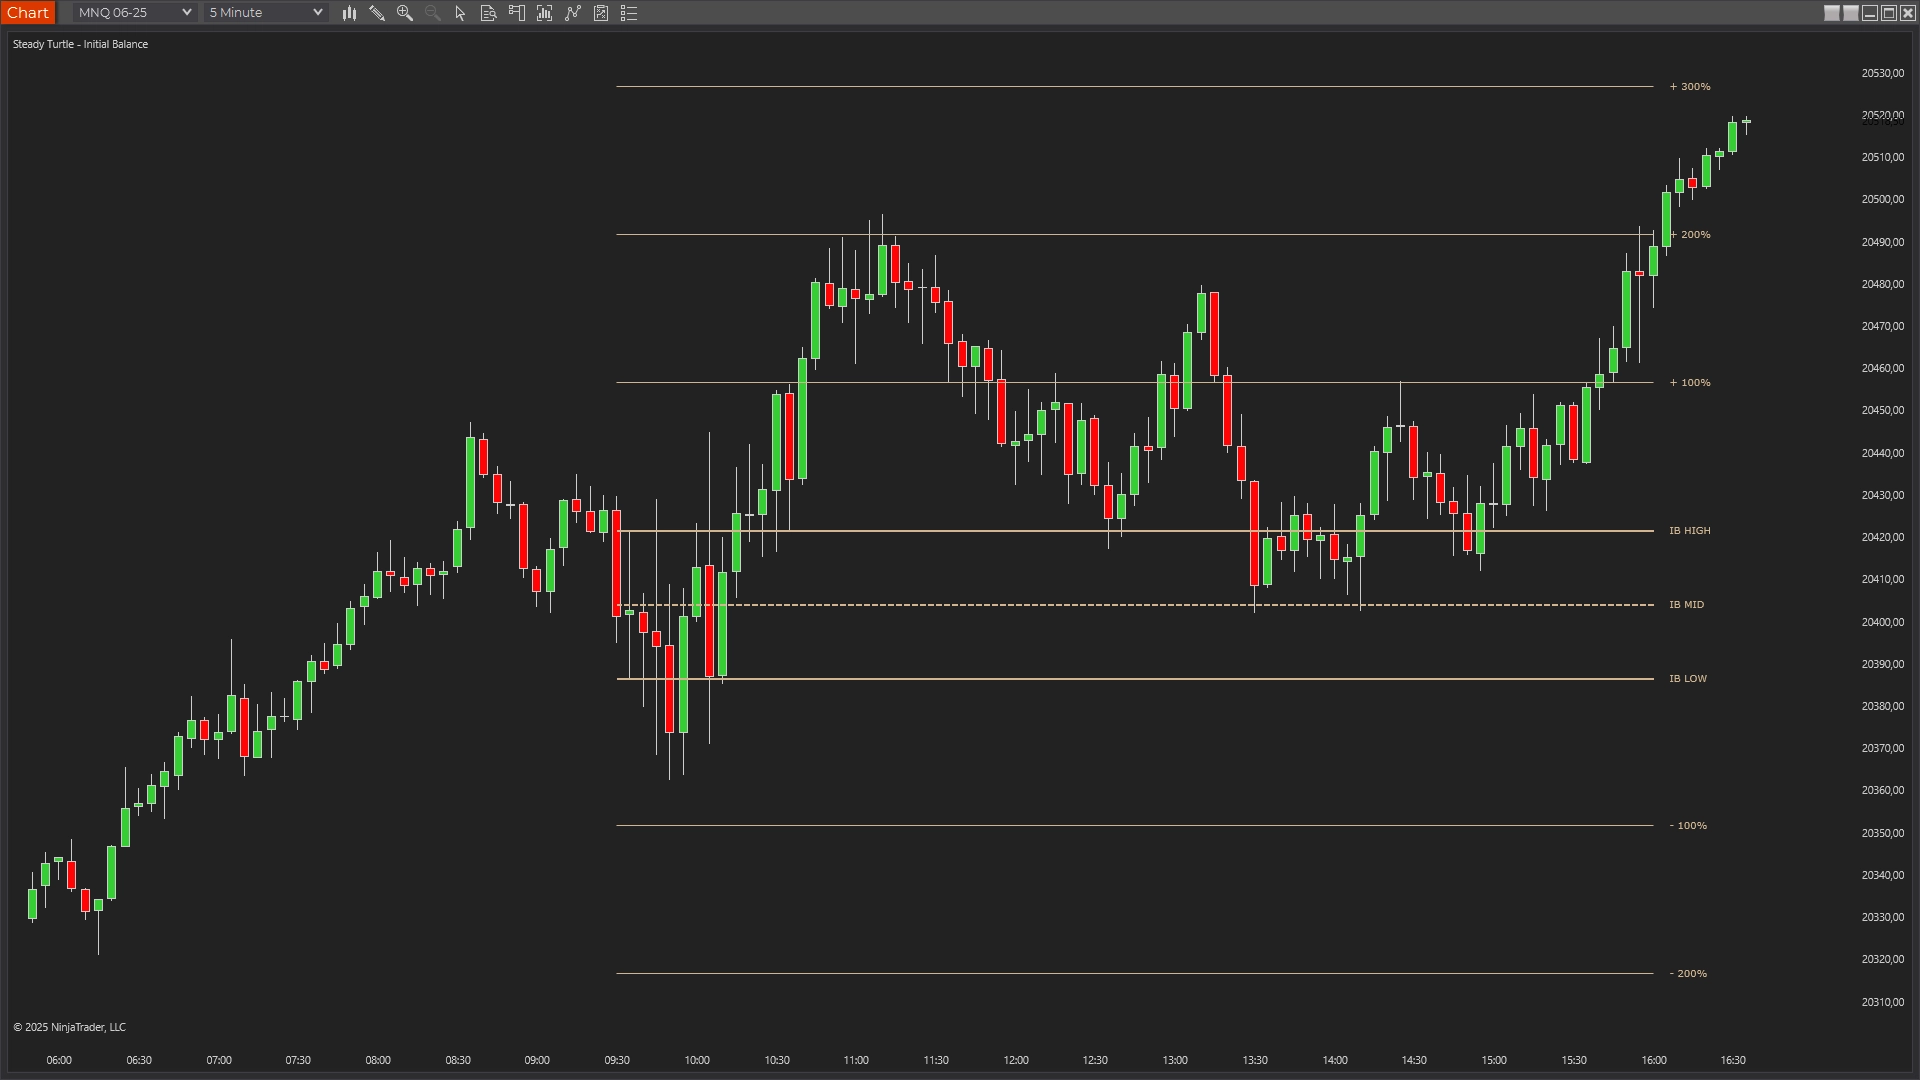
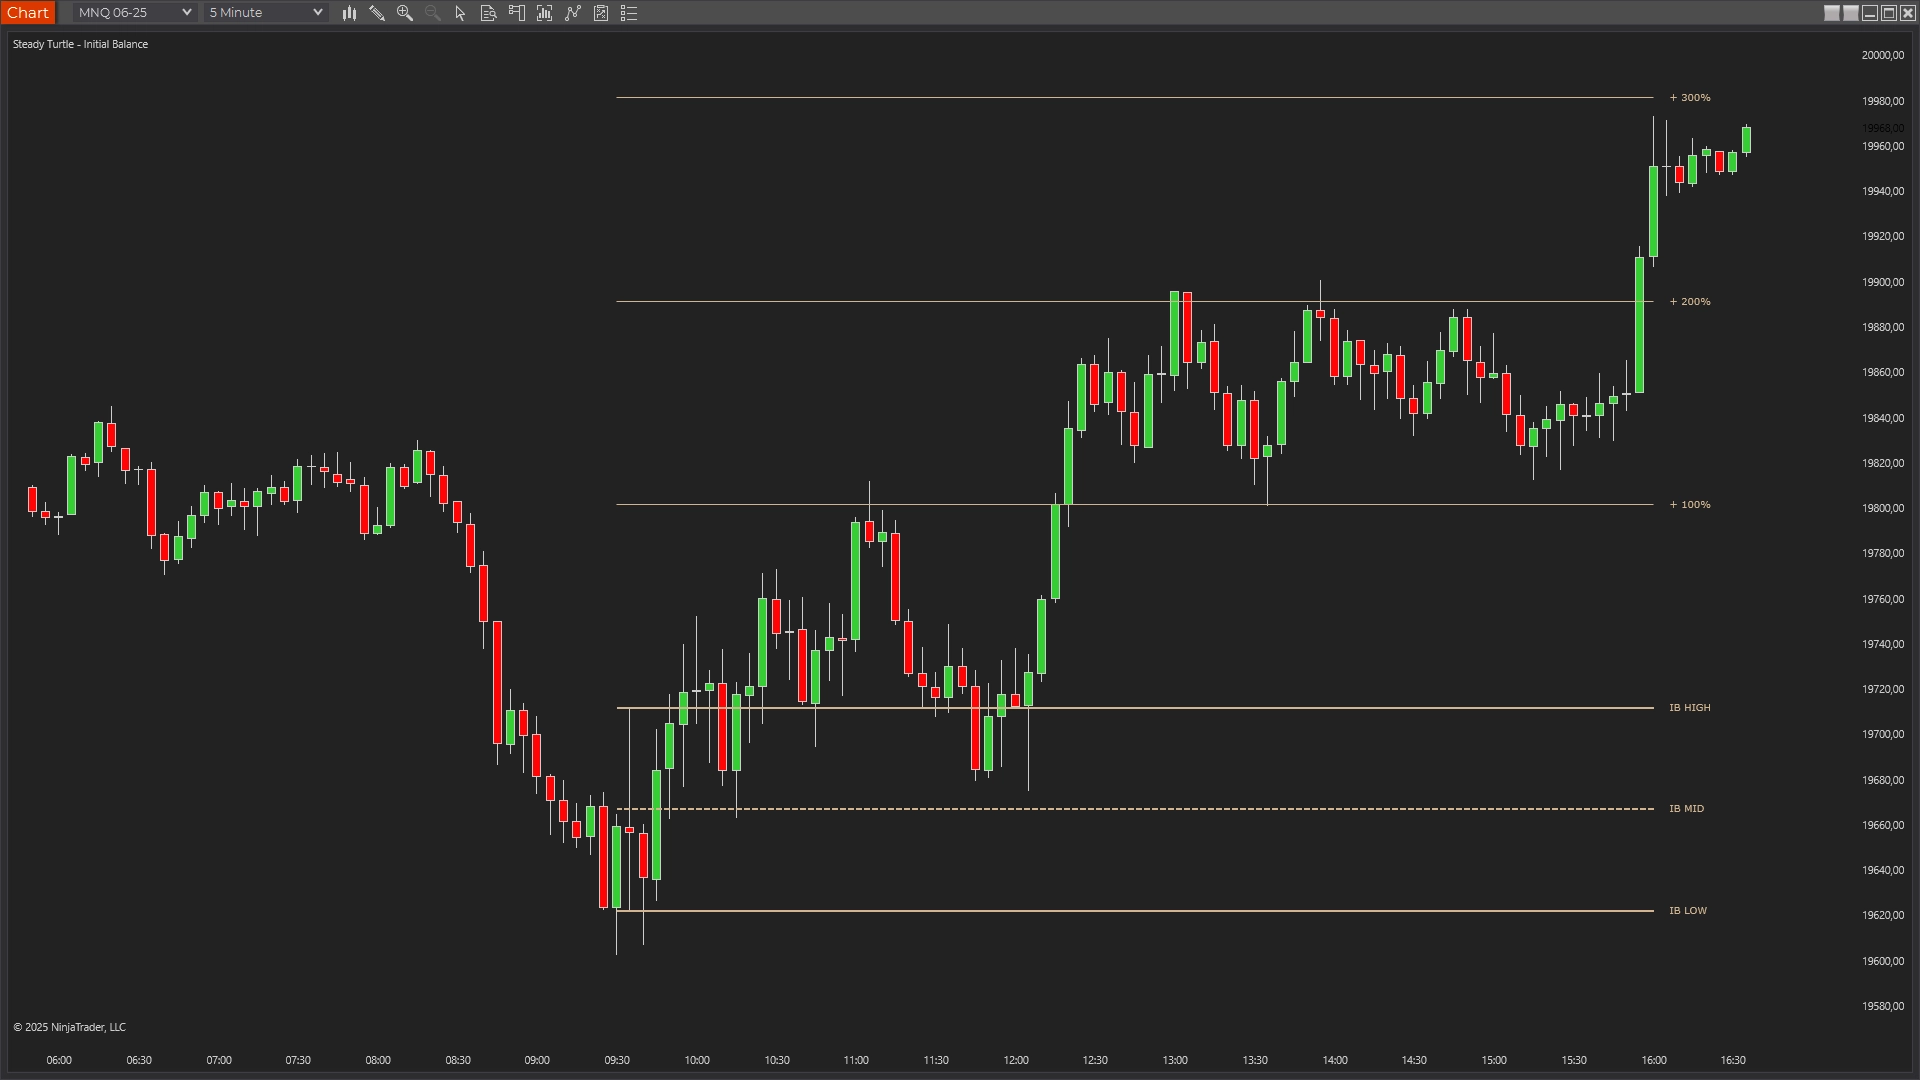
Three live MNQ sessions, the +100% as a profit-taking shelf, the -200% as a floor that held, and IB High as the launchpad for the next leg.
Up to +100%, then
parked.
MNQ 06-26 · RTH · 5mNinjaTrader 8 · live session
A built-in profit shelf.
Price ranges below the IB through the morning, finally clears IB High around 11:30, and walks straight to the +100% extension near 27405. From there it goes sideways for the next four hours, every pullback stops at +100%, every push fails at it. That's the practical use of the extensions: not magic targets, but a pre-drawn shelf where momentum runs out and exits get filled. Take profit at +100%; the rest of the day is for someone else.
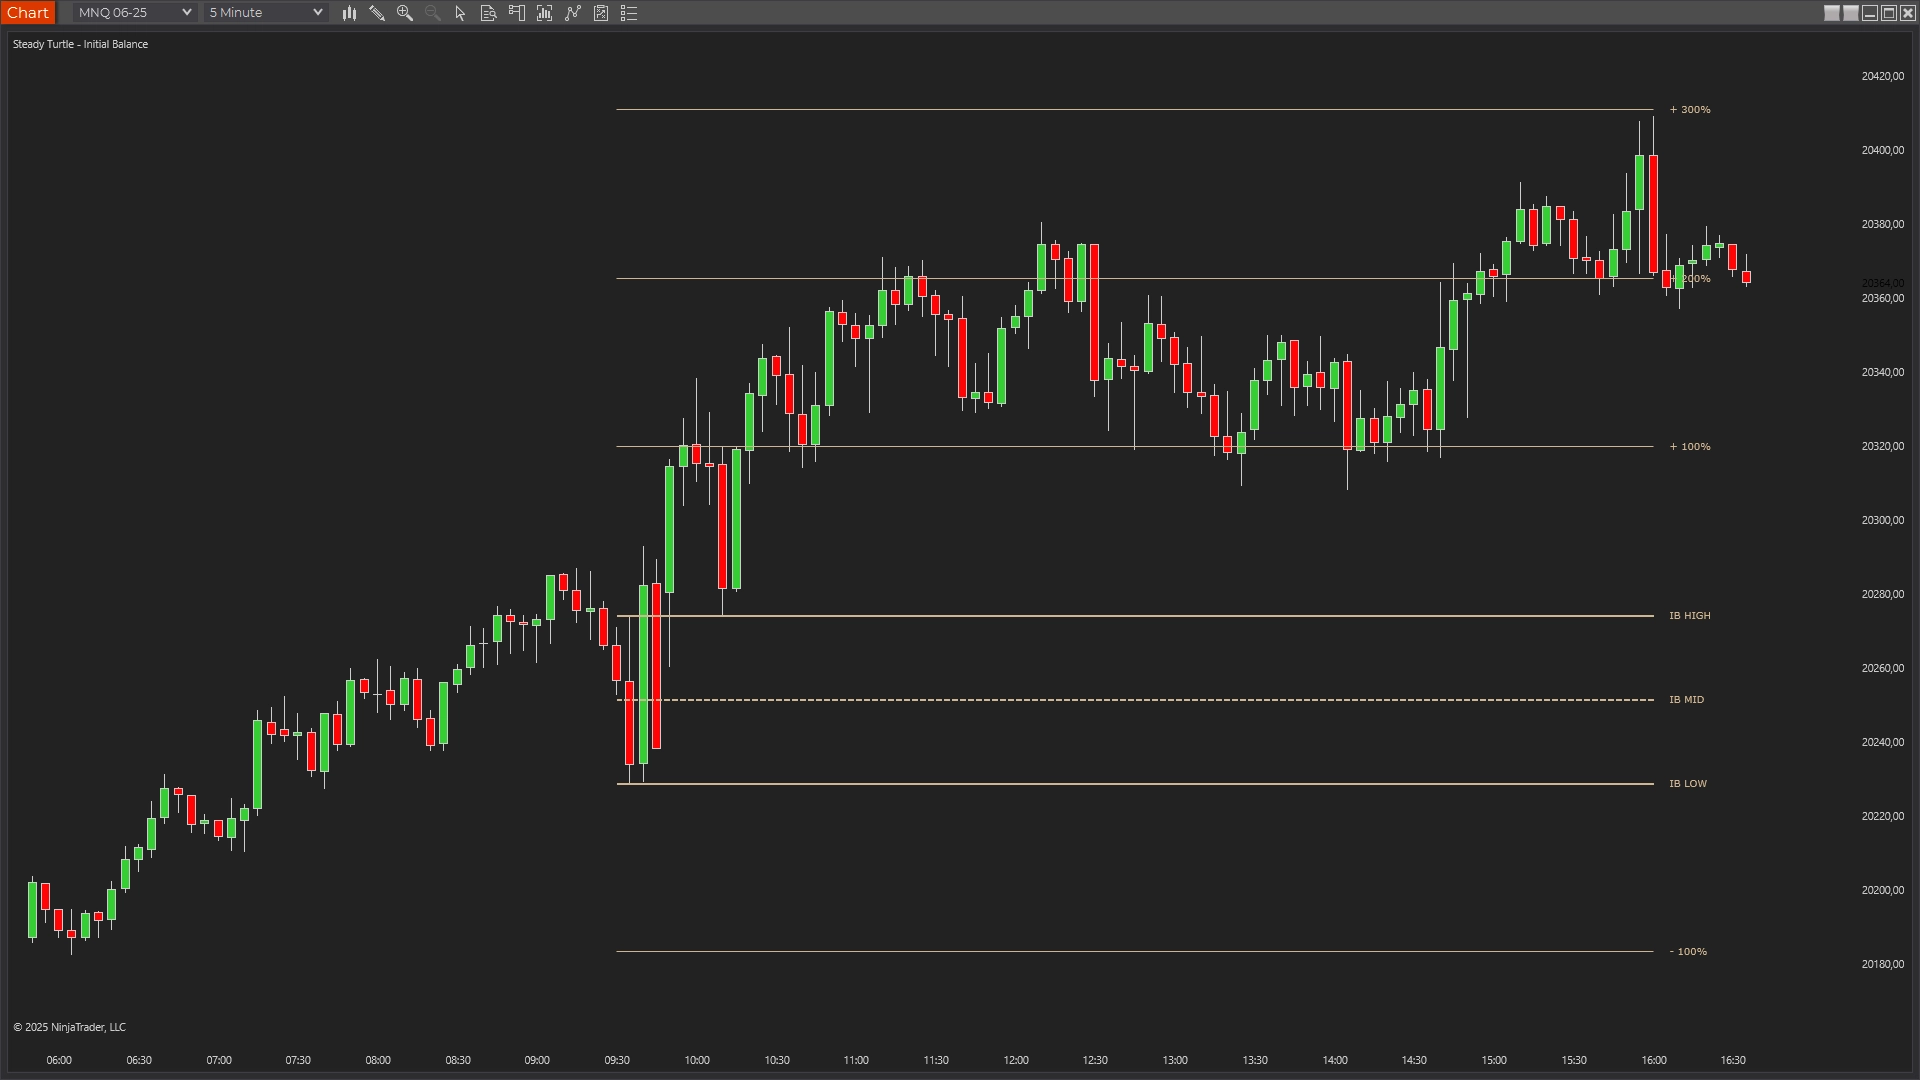
-200% held.
IB Low capped twice.
MNQ 06-26 · RTH · 5mNinjaTrader 8 · live session
Extension as floor, prior level as ceiling.
Price ranges inside the IB until 13:00, then loses IB Low and flushes through -100% straight to -200% near 26710. That's the floor, the candle wicks the level, prints the low, and the rebound starts immediately. But the bounce stalls right at IB Low: tested once, rejected, rolls over, retested an hour later, rejected again. The level that broke the trend down becomes the level that caps every relief rally for the rest of the session.
IB High as the
launchpad.
MNQ 06-26 · RTH · 5mNinjaTrader 8 · live session
Former resistance, now support.
The IB locks with price already pressed against IB High. For the next three hours the level acts as a floor, every pullback into 26995 finds bids, every push higher gets sold for a few points before returning. That's not stalling, that's accumulation. At 13:00 the consolidation resolves up, and price advances to fresh highs without ever revisiting IB High again. The line you drew at 10:30 ended up framing the entire afternoon.
What traders
actually
say.
Three quotes, three different reasons this one earned a slot in the workspace.
★★★★★
“The first hour is where my strategy lives. This draws the IB automatically and gives me clean extensions, I don't have to think about levels, I just trade what the indicator already framed.”
Verified buyer
★★★★★
“Extension levels give me profit targets for the whole session, and the midpoint is clutch for finding re-entries after the first move. I use it with Volume Profile, when IB extensions line up with HVNs, those are the cleanest setups.”
Verified buyer
★★★★★
“Market-profile Initial Balance done right, no gimmicks. The +100% and +200% lines are where I size into continuation trades, and -100% is where I'm ready to stop out if the IB breaks down instead.”
Verified buyer
PricingOne-time · No discounts · No expiry
One indicator. Or everything.
À la carte is $49. The bundle is $299 for everything, including every indicator I ship next year.
Everything traders ask me before they buy. If yours isn't here, email me →.
The Initial Balance (IB) is a market-profile concept: the price range established during the first period of RTH trading. The traditional definition is the first 60 minutes (09:30-10:30 ET), that's the default. The high and low of that period create the structural frame for the rest of the session, and extensions above and below (multiples of the IB width) become the targets most trend days run toward.
Extensions are multiples of the IB range, symmetric above and below. If the IB spans 20 points (IB High 5020, IB Low 5000), the +100% extension sits at 5040, the +200% at 5060, the -100% at 4980, and so on. The indicator ships with +100%, +150%, +200%, +300%, +400%, and +500% levels (plus the matching negatives), each toggleable so you can dial the chart to whatever density you want.
Yes, start and end times are configurable. 60 minutes is the default because it's the classic market-profile IB, but 30 and 90-minute variants are common. The indicator recalculates the high, low, midpoint, and all extensions based on whatever window you set, run multiple instances with different windows if you want.
Both track a range after the cash open, at different durations and with different outputs. Opening Range is the short window, default 5 minutes, with a simple high/low/midpoint. Initial Balance is the longer, market-profile window, default 60 minutes, and adds percentage-based extension targets (+100%, +200%, etc.) beyond the range itself. Running both is common: OR for the earliest directional tell, IB for the session's structural frame and target ladder.
Any instrument NT8 can chart, ES, MES, NQ, MNQ, YM, RTY, CL, GC, equities. The indicator uses a configurable time window, so it works on any market with a defined session open. Default is tuned for US index futures and the 09:30 ET bell.
Times are specified in ET and the indicator respects your NinjaTrader timezone settings. Whether you're trading from Europe, Asia, or the US west coast, the IB window draws at the correct wall-clock time for the ET reference.
Yes, the window is fully configurable. Set Start Time to 09:30 and End Time to 09:35 and you get the classic 5-minute opening range instead of the 60-minute Initial Balance. That said, the purpose-built tool for that job is the Opening Range Breakout indicator, it adds the box styling and breakout framing the 5-minute window is actually used for. The 60-minute default here is the standard market-profile Initial Balance.
Yes, every edition, Free NT8, NT8 Lifetime License, and every tier in between. The only requirement is NinjaTrader 8 version 8.1.7 or newer. The indicator authenticates through NinjaTrader's email-based licensing, which needs a current build; older versions can't authenticate. Update via NT8's Control Center → Help → Check for Updates first if you're on an earlier version.
Yes, anywhere you sign in to NinjaTrader 8 with your user email. The license is tied to your NT8 user, not the machine, so desktop, laptop, and VPS all work the same. One user, unlimited machines.
Yes, lifetime updates. Every new version is free forever. If you buy the Complete Bundle, every future indicator I ship is also included at no extra cost.
Indicators are non-refundable, once you download, the software is yours to keep. Two ways to de-risk before buying: (a) try any of the free indicators first to confirm they load and run on your setup, and (b) email me with any pre-purchase questions at info@steady-turtle.com.
Every knob,
exposed.
A fully configurable IB window, six extension pairs you can toggle individually, and line styles to match any workspace. Here's what ships in the settings panel.
Name
Default
What it does
Start Time (ET)
09:30
When the IB calculation begins. Default is the cash open.
End Time (ET)
10:30
When the IB locks. The high, low, midpoint, and extensions all freeze at this time. Default is 60 minutes, change to 30, 90, or any custom window.
Extend Lines Until (ET)
16:00
IB and extension lines stop drawing after this time. Default ends at the RTH close.
Max Sessions
5
Maximum number of past sessions the indicator keeps on the chart.
Session Name
IB
Prefix used in level labels (IB H, IB L, IB M). Change to match a custom naming scheme.
Show 100% Levels
True
Draws +100% and -100% extensions. The first target pair.
Show 150% Levels
False
Draws +150% and -150% extensions. Off by default, enable for higher-resolution targets.
Show 200% Levels
True
Draws +200% and -200% extensions. The second target pair.
Show 300% Levels
True
Draws +300% and -300% extensions. Reached on strong trend days.
Show 400% Levels
True
Draws +400% and -400% extensions.
Show 500% Levels
True
Draws +500% and -500% extensions.
IB Color
Tan
Color for the IB high, low, and midpoint lines.
IB Line Style
Solid
Dash style for the IB high/low lines (Solid, Dash, Dot, etc.).
IB Line Width
2
Width of the IB high/low lines (1-10).
Extension Line Style
Solid
Dash style for extension lines. Dotted or Dashed helps distinguish extensions from the IB itself.
Extension Line Width
1
Width of extension lines (1-10). Default is thinner than the IB lines by design.
Show Labels
True
Show IB and extension level labels at the right edge of each line.
Show Price
False
Append numeric price values to the level labels.
Label Color
Tan
Color for level labels.
Debug Mode
False
Print diagnostic info to the NinjaScript output window. Off unless you are troubleshooting.
While you're hereOften paired with Initial Balance
$49 buys the indicator. $299 buys everything, plus every one I ship next year. Either way, one payment, no subscription, and it runs wherever you log into NinjaTrader.
Futures and forex trading contains substantial risk and is not for every investor. An investor could potentially lose all or more than the initial investment. Risk capital is money that can be lost without jeopardizing ones' financial security or life style. Only risk capital should be used for trading and only those with sufficient risk capital should consider trading. Past performance is not necessarily indicative of future results.
Testimonials appearing on this website may not be representative of other clients or customers and is not a guarantee of future performance or success.
Hypothetical Performance Disclosure
Hypothetical performance results have many inherent limitations, some of which are described below. No representation is being made that any account will or is likely to achieve profits or losses similar to those shown; in fact, there are frequently sharp differences between hypothetical performance results and the actual results subsequently achieved by any particular trading program. One of the limitations of hypothetical performance results is that they are generally prepared with the benefit of hindsight. In addition, hypothetical trading does not involve financial risk, and no hypothetical trading record can completely account for the impact of financial risk of actual trading. For example, the ability to withstand losses or to adhere to a particular trading program in spite of trading losses are material points which can also adversely affect actual trading results. There are numerous other factors related to the markets in general or to the implementation of any specific trading program which cannot be fully accounted for in the preparation of hypothetical performance results and all which can adversely affect trading results.